
It was almost a year ago when the Covid-19 induced selloff in the financial markets reached a bottom. The S&P 500 fell from its February 19th peak with record-setting speed: it took only 16 trading days to enter a bear market (a decline of 20% or more from a previous peak). On historical standards, the recovery was exceptional too. The S&P 500 was only in a bear market for a month. Yet despite these (and other) superlatives of the financial markets in 2020, last year also reaffirmed many longstanding investment principles. Here are three investing lessons and takeaways from the 2020 Covid crash and subsequent market recovery.
3 lessons learned from the 2020 Covid market selloff
In case you missed it, here are some of the major events that hit the global financial markets in 2020:
- A global pandemic and shutdown of all major economies
- Lowest yield on the 10-year treasury ever
- Polarizing presidential election
- Oil price war
And still, the S&P 500 closed the year with an 18.4% total return. Here are three key lessons learned from the Covid selloff.
Markets move fast and you can’t time it
The best days in the stock market often fall very close to the worst days. In 2020, the 8 of the 10 worst days of the year for the S&P 500 occurred between 2/27 and 4/1. All of the 10 best days of the year fell between 3/2 – 4/8.
The second worst day of the year, March 12th, when the market was down over 9.5%, was immediately followed by the second best day of the year, when the S&P 500 returned 9.3%. This trend is not unique to 2020. Here are the top 10 best and worst days for the S&P 500 between 1970 and 2020:
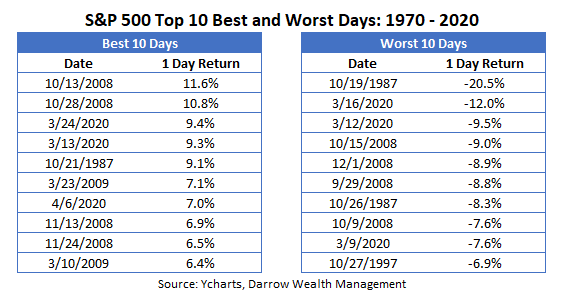
Look carefully at the dates. Not only did many of the best days fall near the worst, but all of the best days occurred during a crisis. The Global Financial Crisis, 1987 crash, and Covid-19 crisis are all represented.
This is a major reason market timing doesn’t work. If investors miss out on just a few days in the market, it can cost them big. From the March low, the S&P 500 went on to gain just over 70% by the end of the year. If you just missed the first week of the recovery, you’d ‘only’ be up 45% by the end of the year.
Longer term, missing out on the 10 best days can impact your financial goals. A J.P. Morgan analysis showed that investors who missed the 10 best days on the S&P 500 between 2001 – 2020 would have an average annualized return of 3.35% vs 7.47% had the individual stayed fully invested. That’s a difference of over 50%!
Diversification works, but it doesn’t mean you won’t lose money
A diversified portfolio means always being unhappy with some component of your allocation. The purpose of diversification is because like broad-based market moves, there’s no way to know when certain sectors, styles, or factors are going to outperform and for how long. So by holding a diverse mix of asset classes, factors, styles, geographies, etc., there’s an excellent chance that some part of your portfolio will be underperforming at any point in time.
And that’s ok.
The goal of diversification isn’t to have more colors to put on a pie chart. It’s a strategy to help improve the probability that during a downturn, a properly diversified portfolio won’t decline in value as much as a concentrated allocation would. But investors can’t have their cake and eat it too.
The tradeoff is that a diversified asset mix likely won’t outperform a concentrated bet in one area of the market when it happens to be outperforming. Different parts of your allocation, like stocks and bonds, have differing jobs in your portfolio.
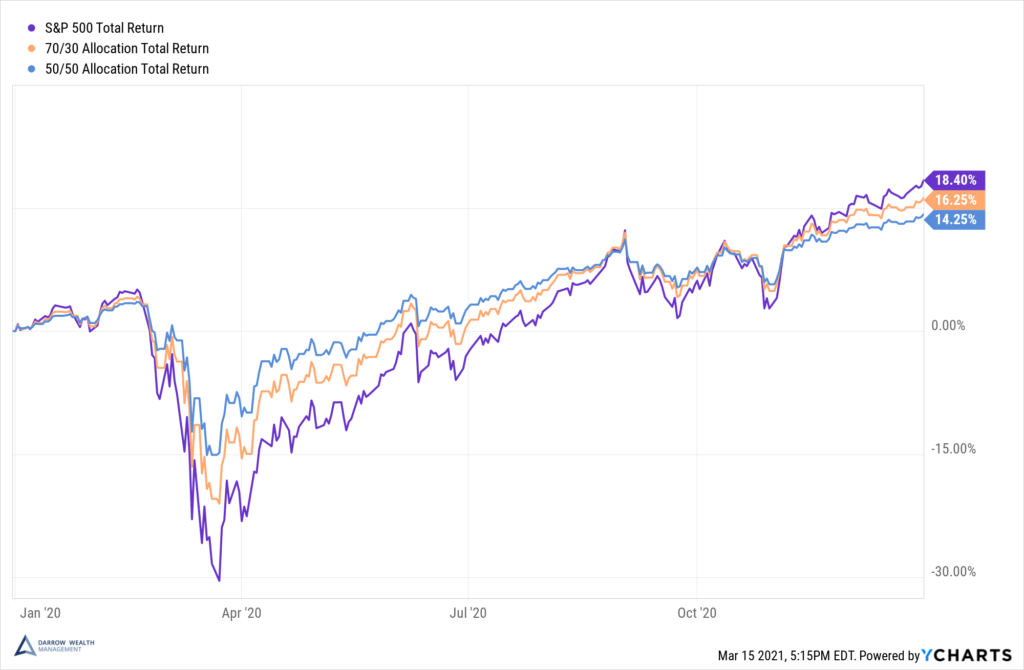
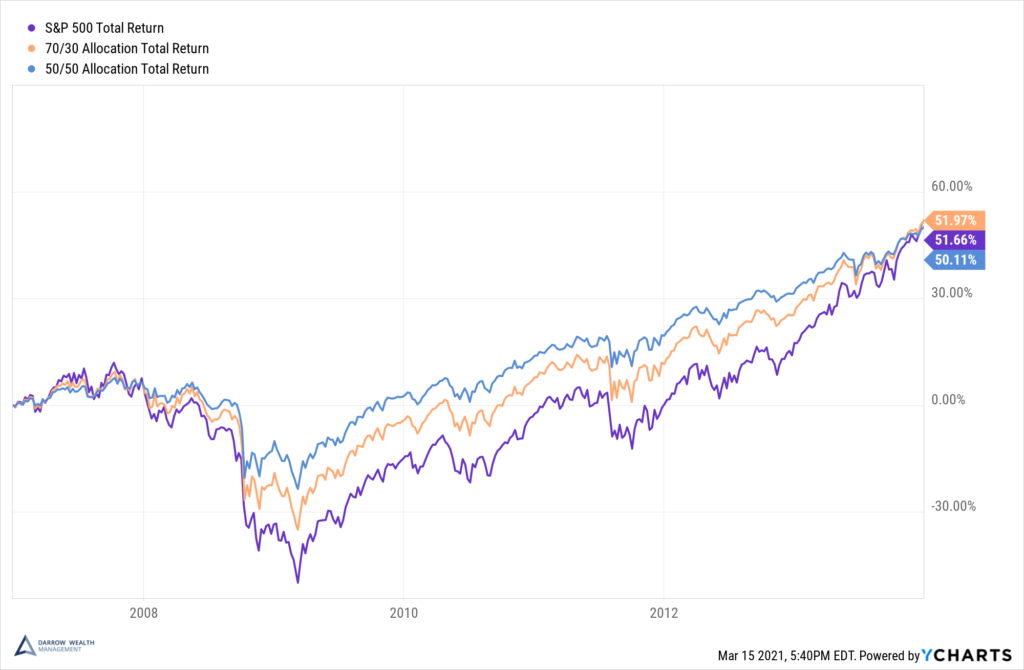
Performance of different asset allocations during 2020 (normalized)
When it comes to meeting your financial goals, reducing volatility really matters. Individuals are most vulnerable to a downturn in the years leading up to retirement or just after. This is due to volatility drag and sequence risk. If your investment portfolio loses 25%, you’ll need a 33% gain just to get back to even. But if you’re taking money out of your accounts during a downturn, there’s fewer dollars left to benefit from the recovery.
The time to diversify isn’t when the sky is falling. In fact, selling and going to cash during a downturn often does more harm than good. As with past selloffs in the financial markets, the Covid crash offers another key lesson: the importance of getting a financial plan in place before you think you need one.
Past performance really isn’t indicative of future results
Investors are so familiar with compliance lingo, they might just gloss over it. And that would be a mistake. Investment professionals don’t have a crystal ball. Historical data is helpful to assess a likely range of possible outcomes, but there are so many factors at play which can drastically alter the outcome for one particular recession, downturn, or bull market.
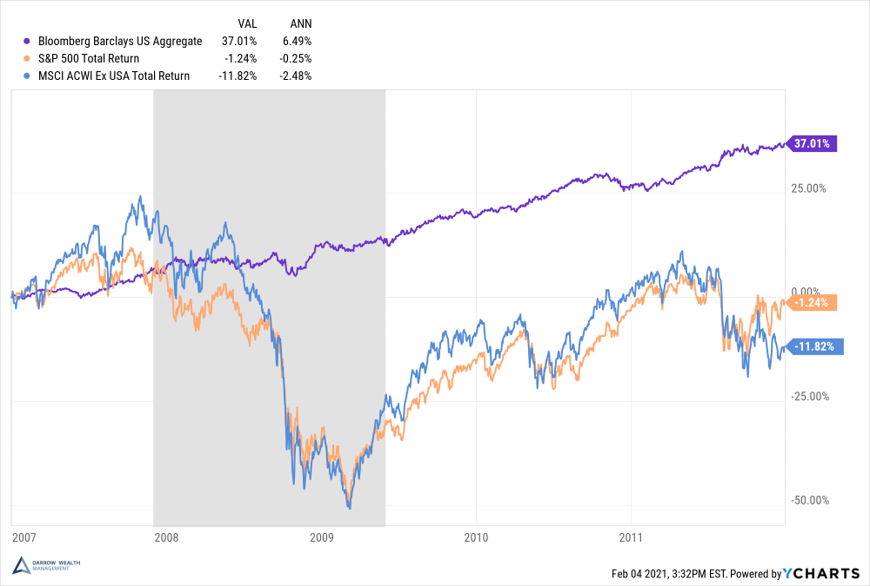
For example, consider the performance of different asset allocations during the 2020 Covid-19 selloff and recovery versus the Great Financial Crisis.
Asset class performance during recessions and bear markets: U.S. stocks vs international stocks vs U.S. bonds (normalized)
Great Financial Crisis – 2007 – 2011
Covid Crisis – 2020
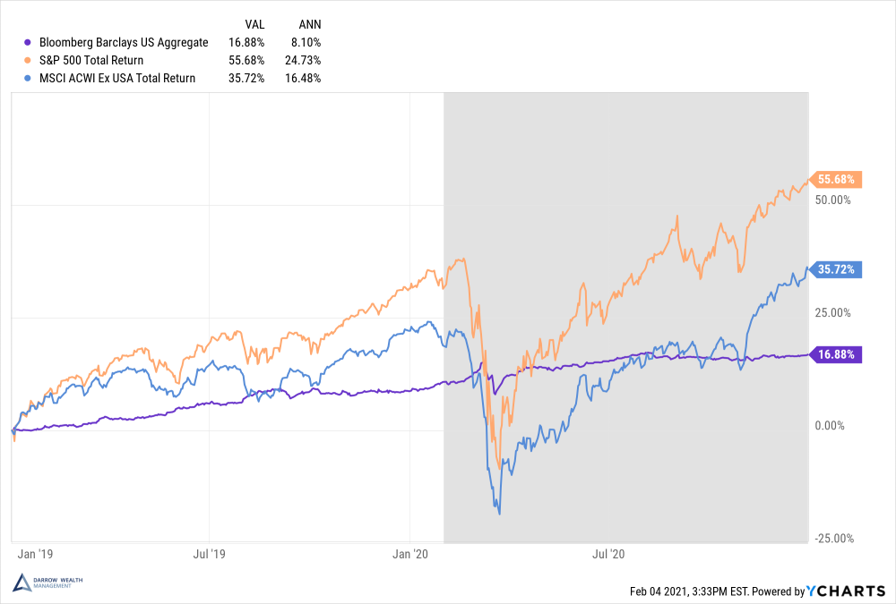
As illustrated above, the benefits of holding bonds in your portfolio were much more significant in 2008 versus 2020. This can be attributed to a number of factors, such as prevailing interest rates and bond yields, the length of the recovery, equity valuations, economic conditions, and severity of the downturn.
Performance of different asset allocations during the Great Financial Crisis (normalized, 2007 – 2013)
According to data from J.P. Morgan, the average bear market decline is 42% from peak to trough and the average duration is 22 months. The GFC began in October 2007 and the bear market lasted 17 months, which included a 57% decline from peak to trough. In contrast, the Covid crisis in the markets had a maximum decline in the S&P 500 of 34% and the bear market lasted only one month.
In the last recession and bear market, the recovery took much, much longer and the benefits of diversification were more pronounced.
Applying the investing lessons from 2020
When developing your investment plan and financial strategy, don’t lose sight of your own risk tolerance, financial needs, time horizon, and goals. With headlines buzzing about Bitcoin and GameStop, it can be temping for investors to play someone else’s game.
Sometimes, a diversified portfolio may feel like missing out, but in other situations, it can literally be a saving grace. Instead of chasing the S&P 500, focus on what’s important to you. Why are you investing? Think about maintaining the lifestyle you want in retirement, putting the kids through school, traveling, leaving a legacy, or another goal that can be furthered by the right financial strategy. Invest for the long-term and for your goals.
This article was written by Darrow advisor Kristin McKenna, CFP® and originally appeared on Forbes.
Important Disclosures
All indexes are unmanaged and an individual cannot invest directly in an index. Index returns do not include fees or expenses. Both past performance and yields are not reliable indicators of current and future results. Examples in this article are generic, hypothetical and for illustration purposes only. This is a general communication for informational and educational purposes only and not to be misinterpreted as personalized advice or a recommendation for any specific investment product, strategy, or financial decision. This material does not contain sufficient information to support an investment decision and it should not be relied upon by you in evaluating the merits of investing in any securities or products. If you have questions about your personal financial situation, consider speaking with a financial advisor.