
As the next U.S. presidential election nears, investors may be wondering what the implications are for their investments. How will the stock market react if the incumbent (President Biden) wins? What will markets do if the current Democratic administration is replaced by a Republican one? How does the stock market perform when Republicans or Democrats have control of Congress vs when it’s mixed? Although volatility is often heightened during an election year, historically, US stocks have ended the year with gains more frequently compared to non-election years.
The good news is that over the long-term, the stock market has performed well under all types of presidential administrations. Here are several charts to illustrate the stock and bond market performance by president.
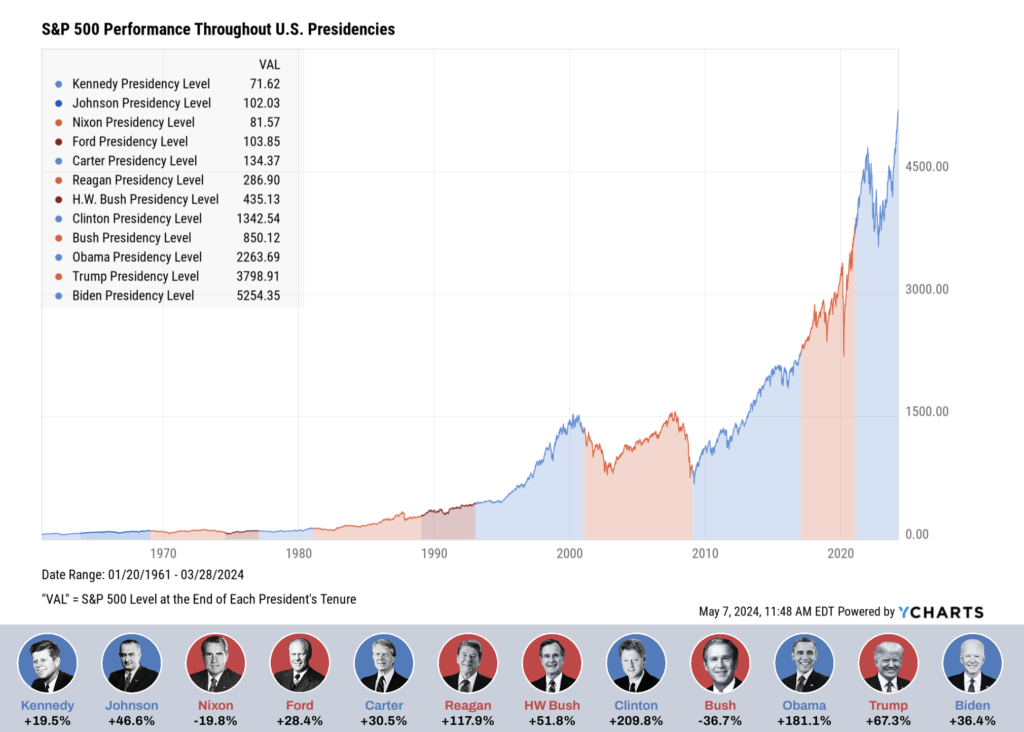
U.S. Stock market performance by president (S&P 500)
Under both Democratic and Republican presidents, the stock market has generally performed well with an upward trajectory over the long-term. It’s important to keep in mind the myriad of other factors that impact stock market performance aside from who is elected as president of the United States. For example, the September 11th terrorist attacks and the 2008 Great Financial Crisis occurred under President G.W. Bush.
President Obama’s term, starting in 2009, began when stock market valuations were near the bottom and as is well documented now, the stock market went on to its longest bull market in history. The impact of policy here can be debated, but the key takeaway is the limited control any administration has and the impact unanticipated and uncontrollable events can have for or against the stock market.
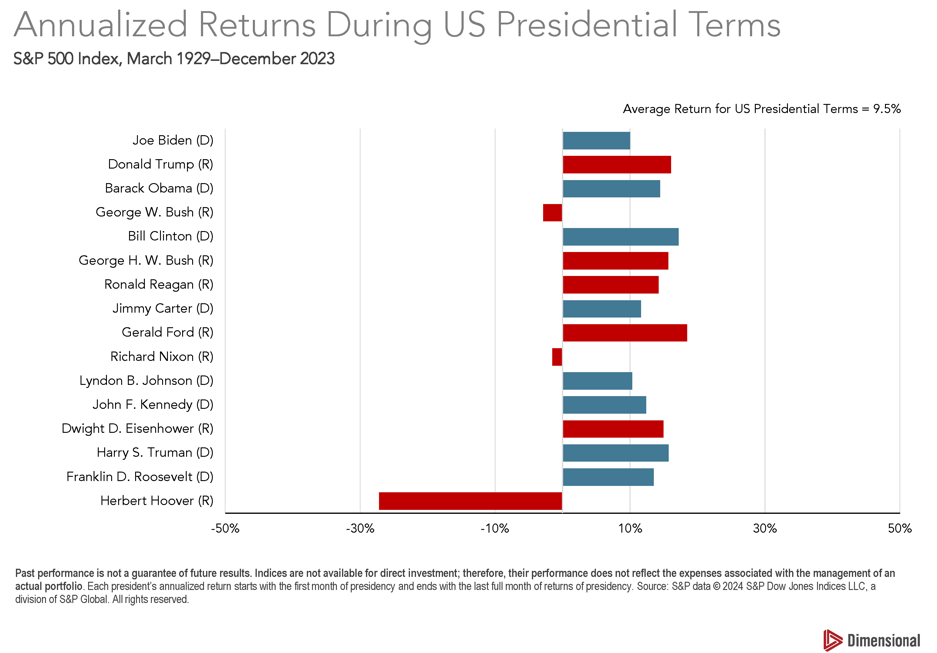
Annualized U.S. stock market returns during presidential terms
Since 1929, only three presidents have experienced negative returns for the S&P 500 on an annualized basis over the course of their term(s). The average annualized return for a president’s term is over 9.5%.
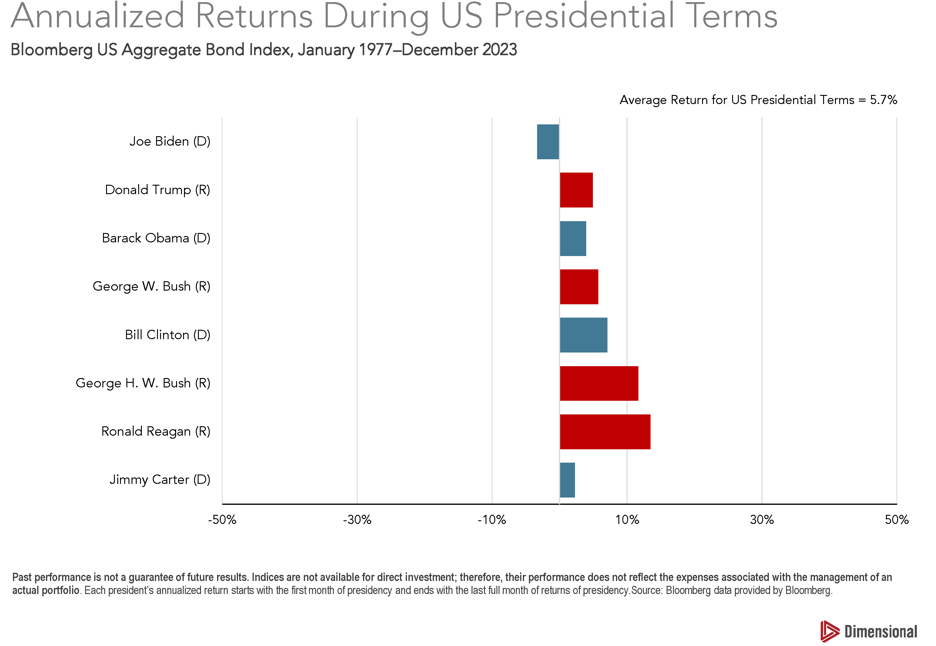
Annualized bond returns during presidential terms
As expected, the volatility in the bond market is much less than equities. Since 1977, only president Biden his tracking to have negative annualized fixed income returns over the course of their administration.
Just like the stock market, the president does not control the bond market, either. Monetary policy, interest rates, and inflation are key factors in driving bond returns. While the president has a say in shaping the Federal Reserve Board of Governors, the process involves a series of checks and balances, much like other aspects of our system. Interest rates, which had generally been declining since the 1980s, increased at their fastest pace in recent history in 2022 as the Federal Reserve seeks to tame inflation.
How does the S&P 500 perform during election years?
The markets hate uncertainty more than bad news. A presidential election means the possibility for significant change. Historically, Republicans have valued lower taxes and less regulation (both of which the market likes), but as evidenced in earlier charts, that doesn’t necessarily translate to higher returns during an administration.
Investment returns during an election year are generally driven by a blend of factors. Here are some:
- Whether the incumbent president running for reelection
- Economic/geopolitical climate and expectations
- How close (and unpredictable) the election is
- Key issues of candidate and perceived threat to the stock market (e.g. higher taxes, repeal of business-friendly programs, increased regulation)
- Likelihood of one party controlling Congress after the election
Performance of U.S. stocks during election years vs non-election years
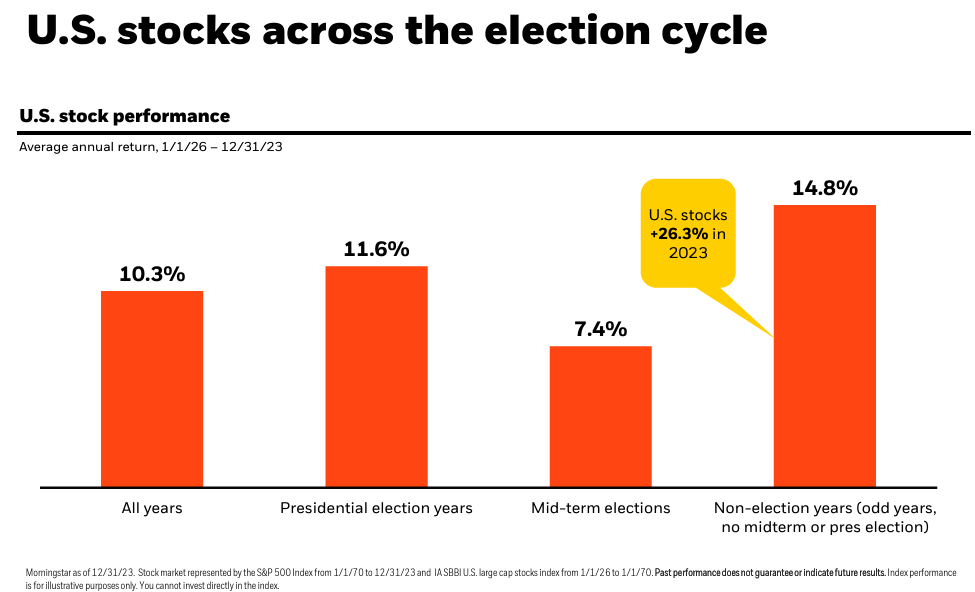
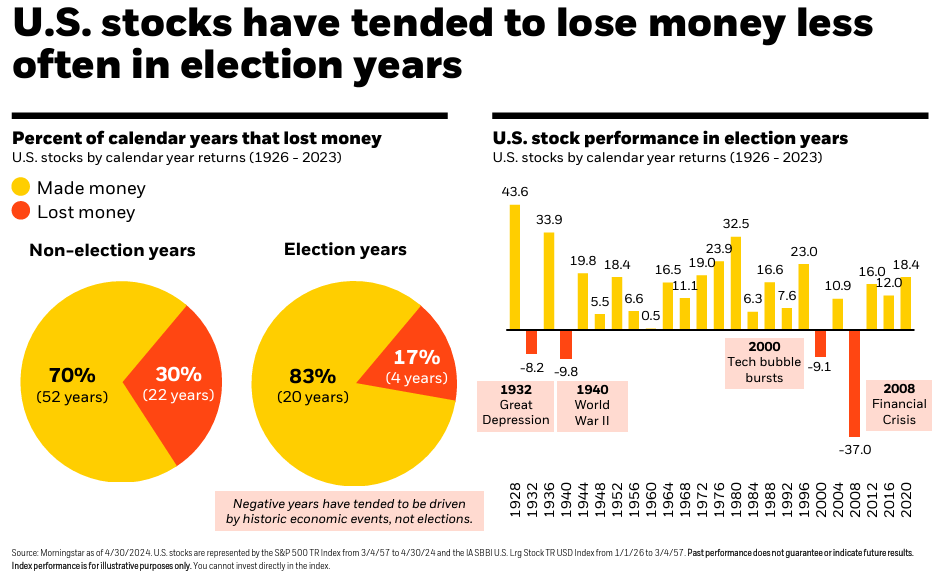
Although historically the S&P 500 has a higher average annual return during non-election years versus election years (previous chart), election years have historically rewarded investors with gains more often than non-election years (chart below). Since 1926, U.S. stocks ended an election year in the red only four times (17%). All were a result of major geopolitical or financial market events versus the election itself. Contrast this with non-election years, and the S&P 500 experienced annual losses nearly twice as often (30%).
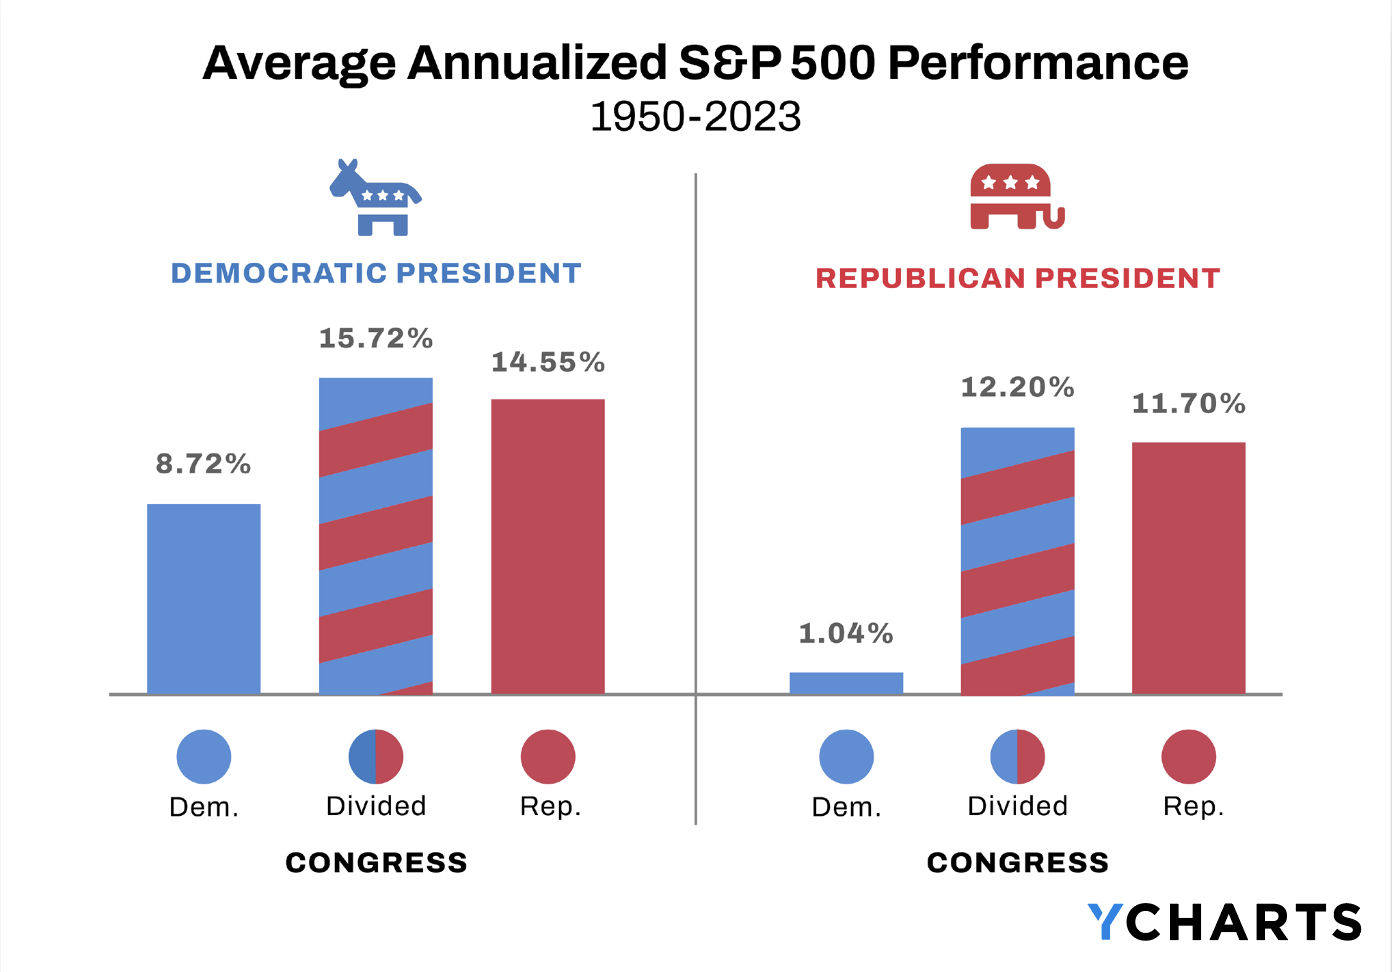
U.S. stock market performance during Democratic, Republican, and mixed party control of Congress
Mixed control of the House and the Senate means more roadblocks to either party’s agenda. This leads to slower change or no change at all. Since the markets are afraid of uncertainty, the status quo might be welcome news. The chart below shows how relatively infrequently there’s a mixed Congress. In either case, it’s impossible to identify any trends when zooming out and looking at the bigger picture over time, as long-term investors should. The stock market is not the economy or the White House for that matter.
According to data from YCharts, since 1950, the mix by political party in Congress and the White House that yielded the highest average annual returns for the S&P 500 is a Democratic president and divided Congress.
How to manage your investments during an election year
Should you make changes to your asset allocation during an election year or after a new president is elected? Probably not. Focusing on what you can control is key when investing for the long-term. It’s all about time in the market…not timing the market.
As illustrated in the chart below, staying invested regardless of who is in office has been the better financial move.
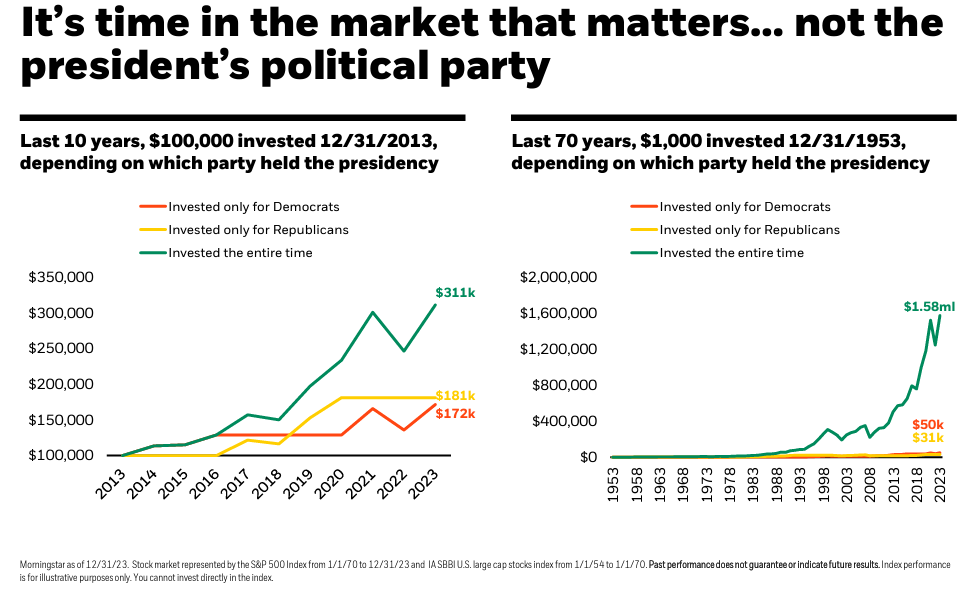
It can be hard, but it’s really important not to allow personal feelings about politics interfere with your financial plan.
Past performance is not a guarantee of future results. Indices are not available for direct investment; therefore, their performance does not reflect the expenses associated with the management of an actual portfolio. This article is for generalized information only and should not be misconstrued as the rendering of personalized investment advice.
Last reviewed May 2024