Setting your asset allocation is like drafting architectural plans when building a home; it provides a map to guide the construction of your investment portfolio. Developing an asset allocation is a multi-step process, which is challenging for many investors, and for good reason. A Google search for the term “how to set your asset allocation” yields 56 million results! How can you tell which sources are credible or which advice is appropriate for your individual situation? Achieving asset class diversification seems more difficult than ever. These four charts illustrate the importance of diversifying between asset classes and within asset classes.
To complicate matters, the universe of mutual funds, ETFs, stocks, and bonds available for investment is vast and includes thousands of options. Fund selection is an often-overlooked step in the asset allocation process. Choosing the wrong funds is akin to picking poor finishes when building your home. A massive open-concept kitchen with a large island doesn’t look so grand with laminate countertops and wall-to-wall carpet.
3 Main Steps in Developing Your Asset Allocation
- Understand your risk tolerance. Based on various factors, such as your financial goals, time horizon, and opinion on an acceptable risk/reward framework, you should come up with a general sense of your risk profile.
- Select your asset classes. Using your risk profile, you will need to decide what percentage of your portfolio to allocate towards the main asset classes. This includes equity (stocks), fixed income (bonds), cash, and real estate. Generally, the more conservative you are, the higher the allocation to fixed income and cash, up to a point. The importance of maintaining a diversified mix of asset classes is the central focus of this article and will be discussed in detail. Once you have your basic allocations, the next step is to define your allocation within these asset classes. For example, the equity asset class can be divided up in a number of ways: large cap, mid or small cap, international developed or emerging markets, Europe, and so on.
- The final step is to identify the best investment funds in each asset class to achieve your desired asset allocation. Here are a few of the top considerations, though there are many: fund longevity, relative performance, investment style (e.g. value vs growth stocks), expense ratio, and trading volume.
This article will only focus on step 2 above and explore why asset class diversification is crucial to mitigate unnecessary risk and reduce volatility in a portfolio.
Asset class diversification: two sides to every coin
What’s Good for the Goose is Good for the Gander?
The old adage meaning what is good for one benefits all does not apply to the financial markets. Take low unemployment for example. Most of us think low unemployment is a positive thing, and generally it is. But for companies, it usually means high-demand workers have more leverage to command higher wages. This hurts profitability for shareholders and positions become harder to fill which impacts sales, ultimately reducing net earnings for shareholders.
There are a number of factors that influence how an asset class will respond to changes in the market or future expectations. These factors include interest rate fluctuations, a company’s quarterly earnings report, news of a merger or acquisition, large capital expenditures, geopolitical risks, environmental and legislative conditions, shifting consumer sentiment, commodity prices, and so forth.
Economic conditions impact asset classes differently
Consider the potential impact of rising interest rates on equity (stocks) and fixed income (bonds). Rising interest rates will increase the cost of borrowing for businesses. Further, equity investors may grow concerned about reduced profitability due to higher debt payments or a delay in capital expenditures intended to produce growth. When net earnings suffer, equity investors may receive a reduced dividend payment or the stock price could drop.
For bondholders, rising interest rates can mean higher yields. When interest rates rise, the prices of existing bonds drop. This is because demand for existing bonds goes down when newer bonds with better yields become more attractive.
Financial markets are intertwined, so this isn’t always the end of the story. Rising interest rates and bond yields often come full circle back to the stock market. If a “risk free” money market fund is now paying 2% interest, up from 1%, equity investors will require a higher return to compensate for the additional risk. This sometimes causes stock prices to fall.
Range of Returns Between Asset Classes
The Callan Periodic Table of investment Returns ranks major asset classes annually by returns and it’s one of the best tools to illustrate the power of asset class diversification. Returns for 10 indices representing major asset classes are plotted from 2002 – 2021 in the table below.
Consider Large cap stocks (S&P 500), ex-US developed equity (MSCI World ex-USA), emerging market stocks (MSCI Emerging Markets) and US bonds (Bloomberg Barclays US Aggregate Bond Index).
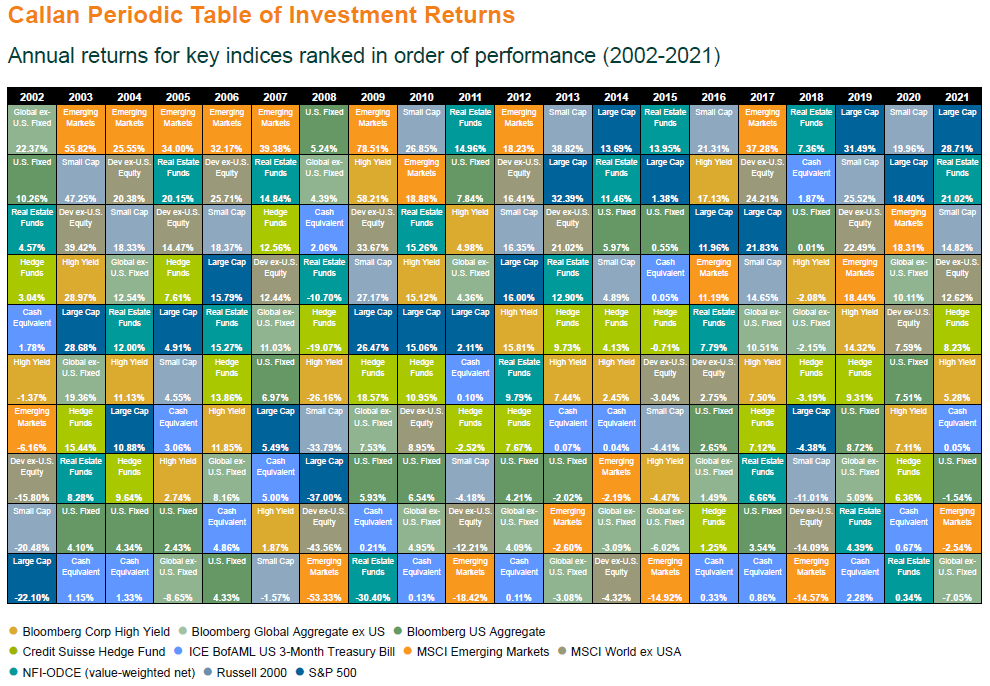
Look at the dispersion between ex-US equities (developed and emerging) and US bonds in most years. US stocks and bonds are more correlated vs the ex-US assets, but there is still a diversification benefit. It’s worth noting that half the time, cash is either the worst performing asset class or second worst.
Asset class correlations change over time so diversification strategies can’t be stagnant. It’s also not a magic bullet: during periods of volatility, correlation tends to increase, even if briefly. One other consideration is time frame. Calendar year returns aren’t exceedingly helpful when looking at a long-term horizon. Rolling time frames offer greater insight but can be more difficult to pinpoint potential causality for change in risk/reward, such as periods of commodity price spikes or geopolitical tensions.
Range of Returns Within an Asset Class
The benefits of allocating funds between different asset classes is pretty well understood. But the reasons to diversify within a particular asset class isn’t as well-known. But the same principles apply.
US Equity
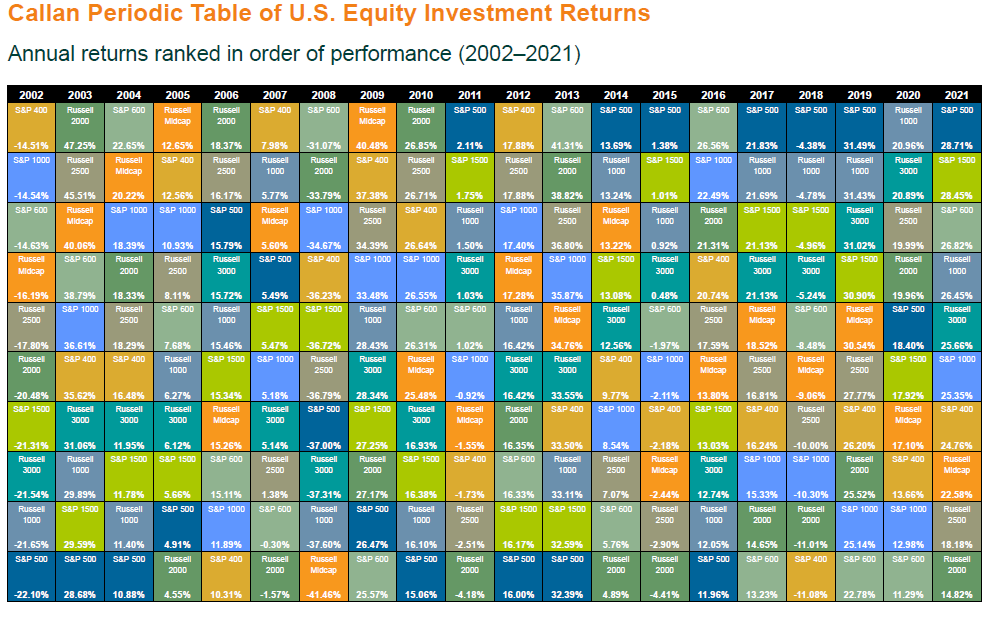
The chart below is another chart from the Callan Periodic Table of investment Returns. This view ranks the returns of various US equity indices.
The Russell 3000 is the most broad-based and diversified index on the chart, representing the largest 3,000 public companies, including large cap, mid cap, and small cap stocks, equaling roughly 98% of the market capitalization of the US stock market.
Historical US Stock Market Returns (Russell 3000, Ranked)
The ranked returns for the Russell 3000 (a proxy for the whole US stock market) typically falls within the middle range of ranked returns. The worst years of ranked performance was 7 out of 10 equity indices and that only happened 3 times.
Russell 3000 vs S&P 500
Using the same table, consider the S&P 500 vs the Russell 3000, both commonly used as a proxy for the whole US stock market. However, the S&P 500 ‘only’ represents about 80% of the US stock market. The S&P 500 beat the Russell 3000 by performance in 10 of the last 20 years. Despite the coin-flip odds, notice how much more volatile the large cap index is compared to the broad-based Russell 3000. Interestingly, 70% of the time the S&P 500 was either the best or the worst performer for the year.
What’s your benchmark?
When selecting investments and looking at data on trends, it’s important to understand that there are multiple well-known indices that can be used to reference the same asset class. And they may have very different constituents and performance. In addition to US stocks (S&P 500 vs Russell 3000) also consider mid-cap stocks (Russell midcap vs S&P 400) and small-cap stocks (Russell 2000 vs S&P 600). In an extreme example, consider mid-cap stocks in 2016: the performance gap was nearly 7%.
There is no one right or wrong benchmark. But as an investor, you just need to be aware of the differences before making generalizations about an asset class.
Key takeaways on asset class diversification
- The stock market and the economy doesn’t always align. This boosts the case for diversification as the most effective way to reduce market risk.
- Developing your asset allocation is an exercise to balance risk and reward. The objective shouldn’t be to invest as aggressively as you ‘can’, rather taking on only as much risk as required to reach your goals.
- Diversification should run deep. Allocating a portfolio between stocks and bonds is usually just the beginning. Other considerations include real estate (REITs), geography, market capitalization, developed vs. emerging economies, sectors and industries, credit rating, cash balance, and so on.
- Depending on your account size, risk profile, and investment expertise, consider whether it’s better to invest using broad-based funds (e.g. Russell 3000) and/or customizing your exposure to select asset classes (e.g. S&P 400) and global markets. Having more control over your asset allocation by customizing your asset mix is often a good idea, but consider getting an advisor to help.
- Investment management is an ongoing process. Each year, review the percentages you allocate to each asset class. Also consider rebalancing as your investment mix is likely to shift as market values fluctuate. Rebalancing is the process of recalibrating your portfolio back to your initial desired asset class mix. Over the long term, as your goals become closer or your life stage changes, you may want to consider whether to take some risk off of the table by shifting the weightings of your main asset classes (e.g. stocks and bonds).
Investment management from a Fiduciary wealth advisor
Darrow Wealth Management is a fee-only investment management firm. Our Private Wealth Management Program uses a proactive 360-degree approach, and as full-time fiduciaries, you can feel confident that you have a trusted partner dedicated to growing and protecting the lifestyle you’re working so hard to build. If you are looking for help managing your investments in the context of your overall financial situation, please contact us to schedule a consultation.
Disclosures
Examples in this article are generic, hypothetical and for illustration purposes only. Both past performance and yields are not reliable indicators of current and future results. This is a general communication for informational and educational purposes only and not to be misinterpreted as personalized advice or a recommendation for any specific investment product, strategy, or financial decision. This material does not contain sufficient information to support an investment decision and it should not be relied upon by you in evaluating the merits of investing in any securities or products. If you have questions about your personal financial situation, consider speaking with a financial advisor.
All indexes are unmanaged and an individual cannot invest directly in an index. Index returns do not include fees or expenses. Past performance is not indicative of future results.


