Amidst the vast uncertainty in the markets right now, it’s more important than ever for investors to understand the benefits—and limitations—of diversification. Having the right investment mix for your situation is critical in good times in the financial markets and during downturns. While you can’t control the ups and downs in the economy, diversification helps to limit the impact on your portfolio.
Market volatility poses new challenges for retirees and older Americans
Thanks to the sequence of returns risk, market volatility doesn’t impact all investors equally, even if they are invested the exact same way. Investors who have recently retired or are on the cusp of retirement face additional market risks.
During challenging times in the global financial markets, diversification can help protect investors against significant negative implications for their portfolio, but it’s important to realize that there isn’t always somewhere to hide.
Going to cash or trying to time the market by buying low and selling high can actually magnify losses. As evidenced in the last couple of weeks, the market can turn on a dime. If you miss even a few of the best days of the year, you can miss out big time.
The best and worst days often happen very close to each other, too: between 1999 and 2018, six of the best 10 days for the S&P 500 fell within two weeks of the 10 worst days.
Unfortunately, there aren’t any shortcuts for investors looking to build wealth that will last a lifetime. Retirement planning, like any type of robust financial planning, should involve a Monte Carlo simulation to account for market volatility. Swings in the financial markets are an uncomfortable but inevitable part of being a long-term investor.
Avoiding big bets can help limit your downside
To highlight the merits of diversification, consider the Callan Periodic Table of Investment Returns which ranks the returns of various asset classes annually from highest to lowest. The table below includes various asset classes such as cash, fixed income, equity, and real estate.
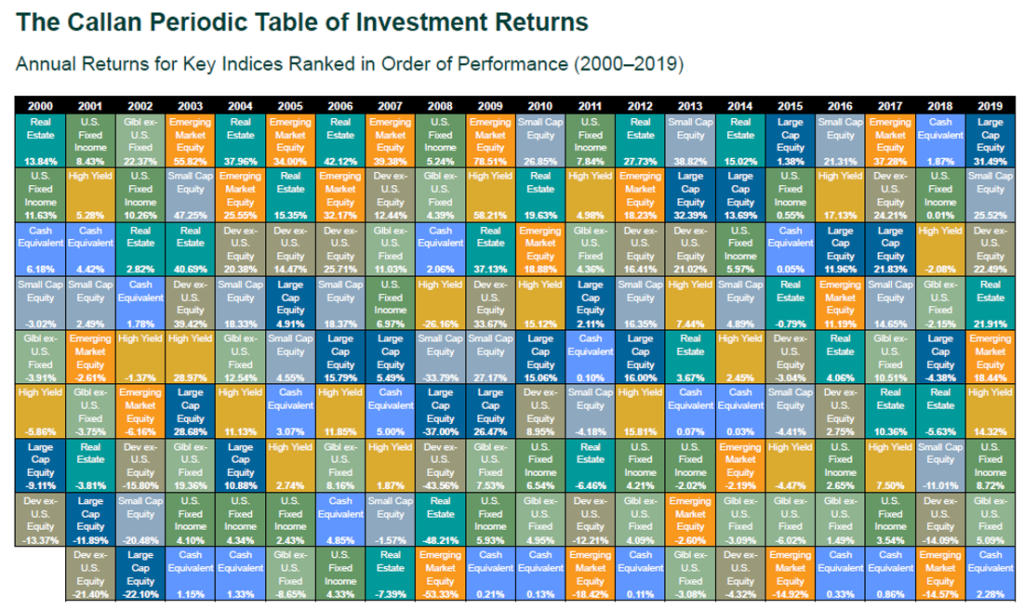 There’s a lot going on here, so the next table highlights only U.S. bonds (as represented by the Bloomberg Barclays U.S. Aggregate Bond Index) and U.S. stocks (represented by the S&P 500).
The chart illustrates how significantly one asset class can (and often does) fluctuate year-over-year, both on its own and on a relative basis compared to other asset classes.
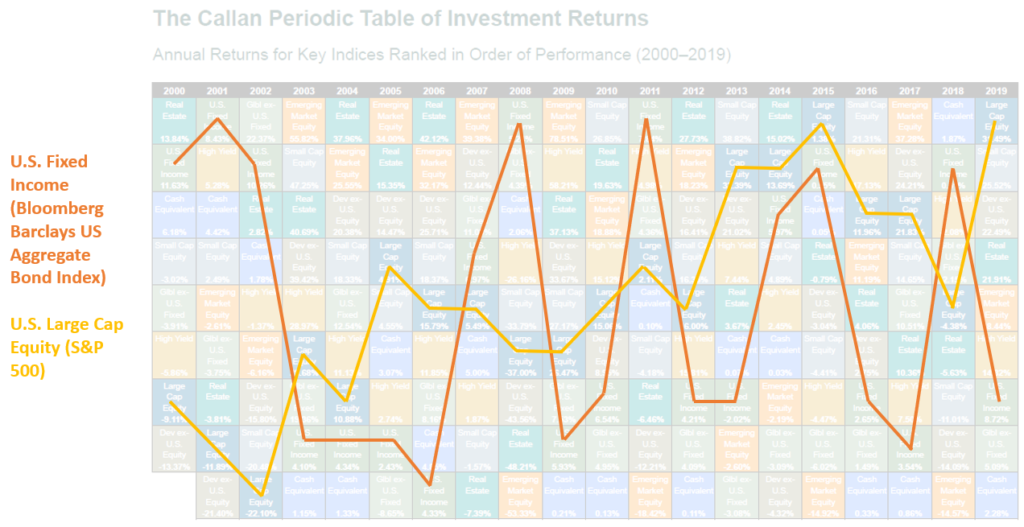 Sometimes these fluctuations are quite drastic: in 2002 U.S. equity was down -22.10% only to come back the next year and produce a 28.68% return! (It’s also worth noting that despite the stellar return in 2003, U.S. stocks landed in the bottom third of ranked returns for the year).
The correlation between bonds and stocks change over time and there’s still a range of returns within an asset class itself. Simply holding a fund that tracks the S&P 500 and the Bloomberg Barclays U.S. Aggregate Bond Index (the indices highlighted above) isn’t enough to ensure your portfolio is properly diversified.
Range of returns within an asset class and across the globe
The S&P 500 gets a lot of attention. Despite making up about 80% of the U.S. stock market, the S&P 500 is only roughly 15% of the value of the global equity market.
This raises two equally important points:
- Why investors need to diversify within broad-based asset classes, and
- Why investors need to diversify outside of the U.S.
Volatility within an asset class
To illustrate the first point, consider another table from the Callan Periodic Table of Investment Returns. The table below ranks the returns of various indices within domestic equity, including: large cap (S&P 500), mid-cap (S&P 400), small-cap (Russell 2000), and the Russell 3000, which represents about 98% of the whole U.S. stock market and includes large, mid, and small-cap stocks.
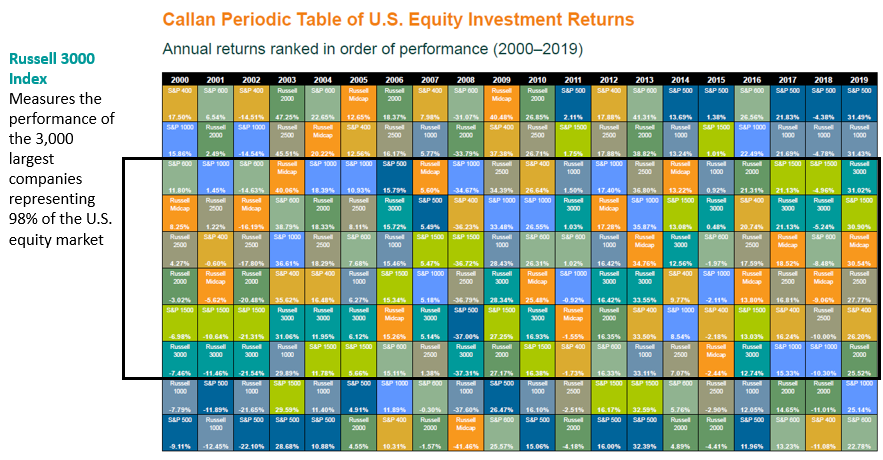
The black box above encapsulates the range of returns for the Russell 3000 between 2000 – 2019. The returns cover a swath of the middle of the chart.
Now look for the dark blue boxes which represent the S&P 500. There were only three years where the ranked return for the S&P 500 fell within this middle section. The rest of the years were essentially boom-or-bust, with the large cap index as the top leader or biggest laggard.
The question really becomes: are you gambling or investing? If you have a few extra bucks and you want to take a flyer on a stock or esoteric fund, there’s nothing wrong with that. The problem is when individuals think they’re investing when they’re actually gambling.
Global portfolios can help mitigate investment risk
The increasingly globalized nature of the world economy makes diversification even more challenging, as evidenced by recently events. Although past performance is not indicative of future results, history can be a helpful lens to view how the market has historically performed during a variety of market conditions.
The chart below shows the normalized percentage change for broad-based global bond and equity indices over the last two decades.
The graph plots: the U.S. stock market (in purple, the Russell 3000), U.S. bonds (in orange, Bloomberg Barclays Aggregate U.S. bond index), global bonds (in blue, Bloomberg Barclays Global Aggregate ex-U.S. bond index), and global equities (in green, MSCI ACWI ex-U.S.).
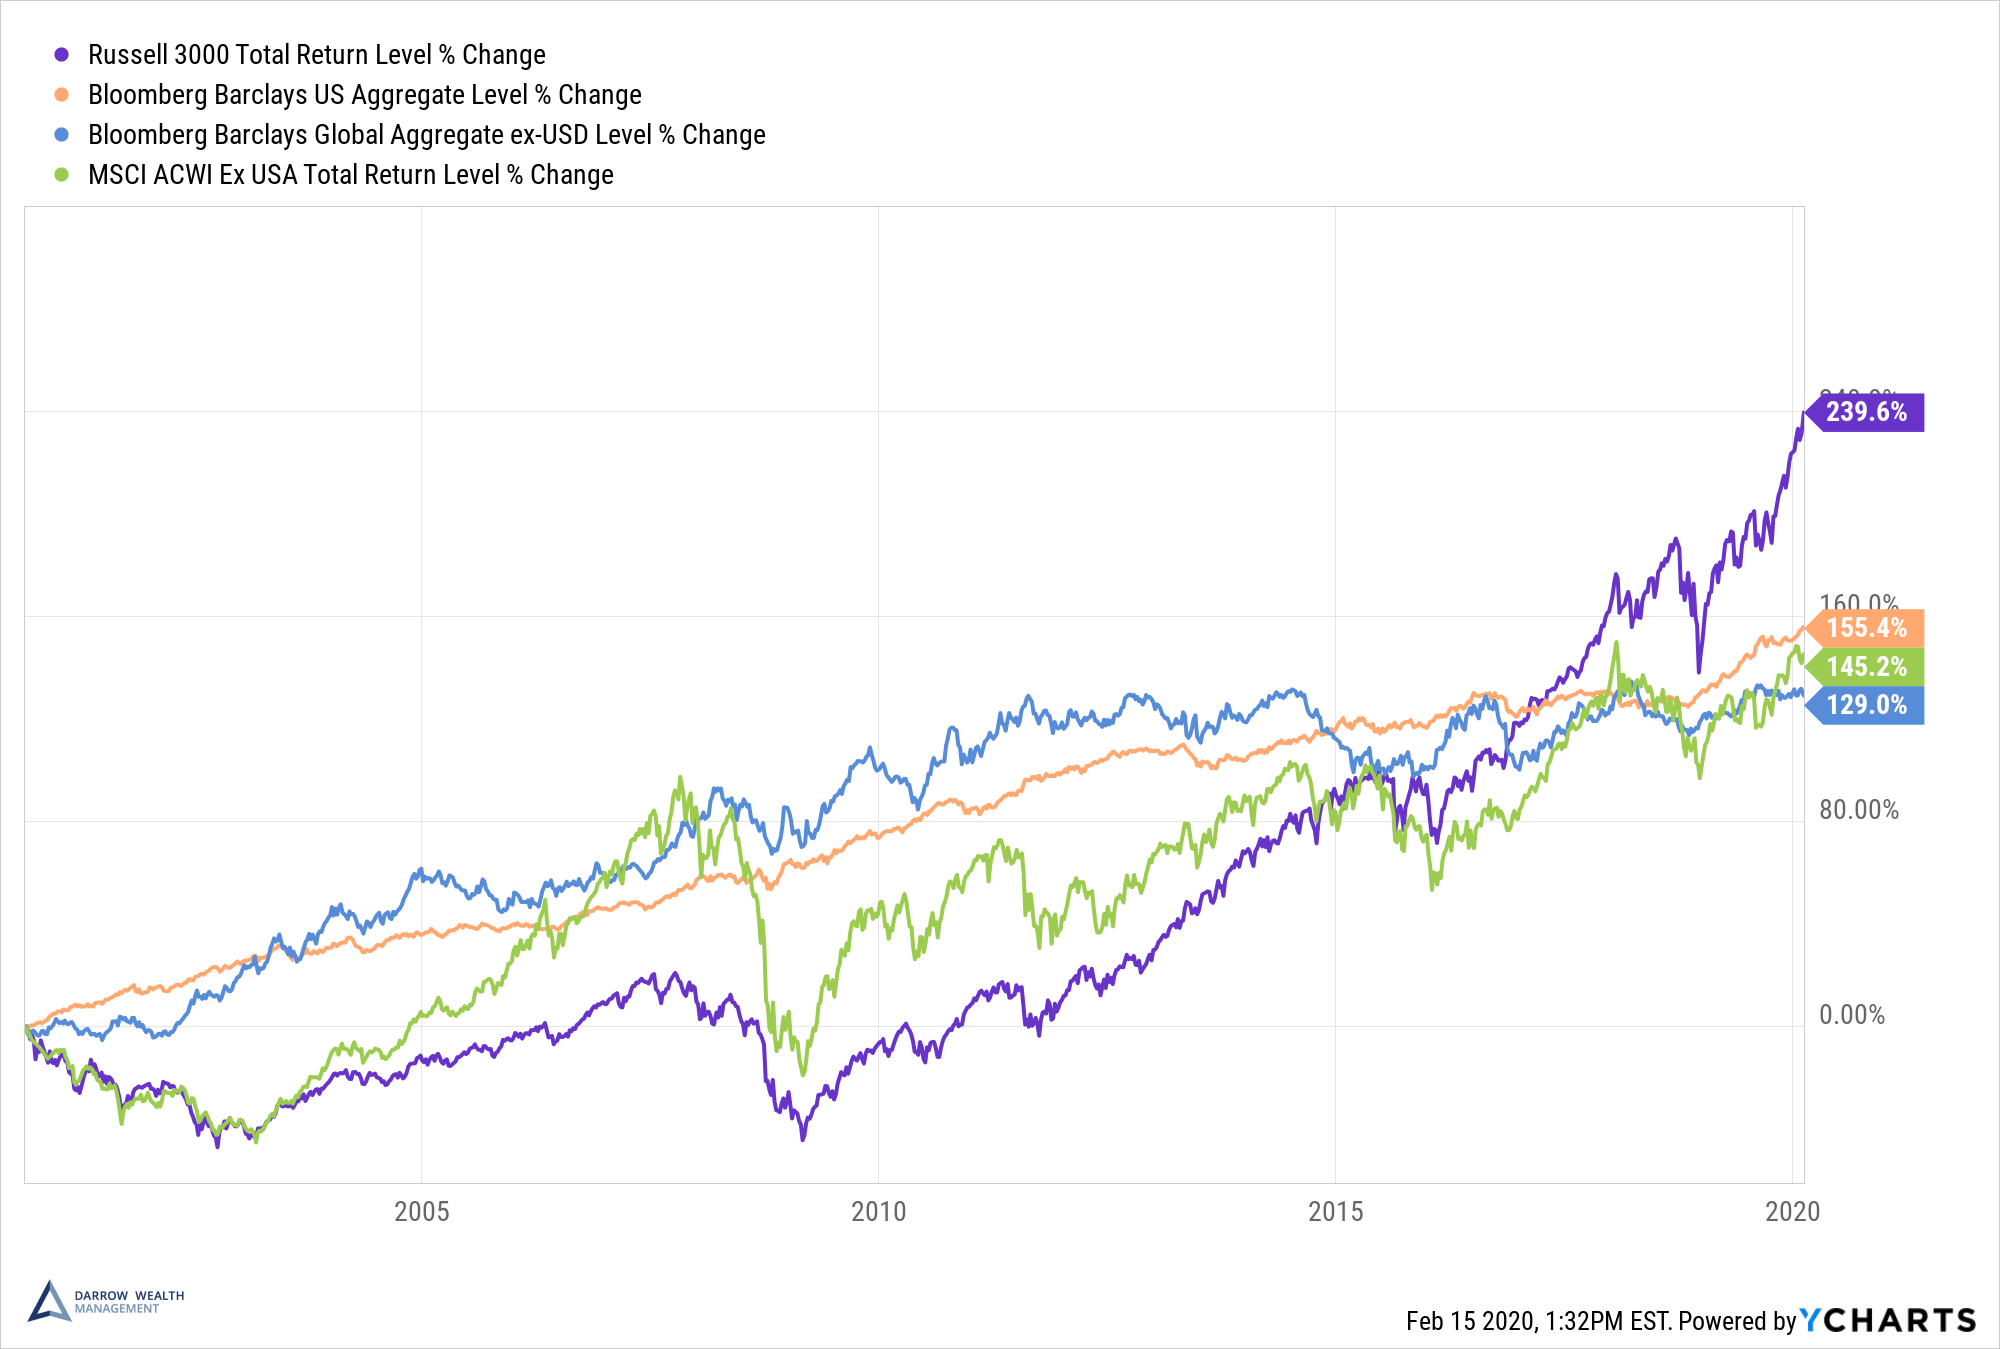 Each asset class manages to come out on top at least once over this period. For an extended period of time during and after the financial crisis, global bonds outperformed the other indices. More recently, the range of returns narrowed, especially around 2017. Other times, such as the 2008 financial crisis, the range of returns between the asset classes are quite spread out.
In another words: your asset allocation might not matter as much when the markets are chugging along (for reference, the S&P 500 was up nearly 22% in 2017), but when economic conditions weaken (like in 2008), the impact of diversification is much more evident.
If you can predict the future, you don’t need to bother with diversification. But for the rest of us, maintaining a diversified portfolio across geographic regions, sectors, and asset classes is one of the best ways to invest for the long-term.
Of course, there’s no magic investment mix and what may work now can shift over time as economic conditions change. A ‘properly diversified’ portfolio can look very different depending on the circumstances for the investor at the time. For example, factors such as income needs, investment time horizon, and the availability of other assets such as real estate or a pension will all play a role in shaping a well-rounded asset allocation.
This article was written by Darrow advisor Kristin McKenna and originally appeared on Forbes.


