
Most investors realize trying to time the market by always buying low and selling high isn’t a realistic endeavor. Yet even with that knowledge, if you have a substantial amount of cash to invest, the thought of investing when the stock market is hovering near all-time highs may give you pause. Similarly, when facing the opportunity to ‘buy the dip’ (remember March 2020?), few investors have the stomach to do so.
As reasonable as these examples may sound, they both describe aspects of market timing. Despite the recent pullback in the U.S. stock market, the S&P 500 has already set 10 new record highs in 2021 and coming off two very strong years. So what should you do if you have cash to invest and the market is strong?
Should I invest when the market is high?
Sitting in cash just because the S&P 500 is setting new highs is a mistake on several levels. First, when investing, it’s critical to make decisions based on long-term expectations, not short-term market moves. Second, past performance is not indicative of future results. Setting new highs doesn’t necessarily mean the market has peaked and a correction is imminent, just as a pause during a sharp selloff doesn’t mean there’s not still further to fall.
Further, historical data does not support the idea that investing cash when the market is high is likely to produce lower future returns. In fact, according to J.P. Morgan, investing on days where the S&P 500 closed at a new all-time high can actually produce better returns than investing on a day where the market didn’t set a new record.
Investing at new highs…
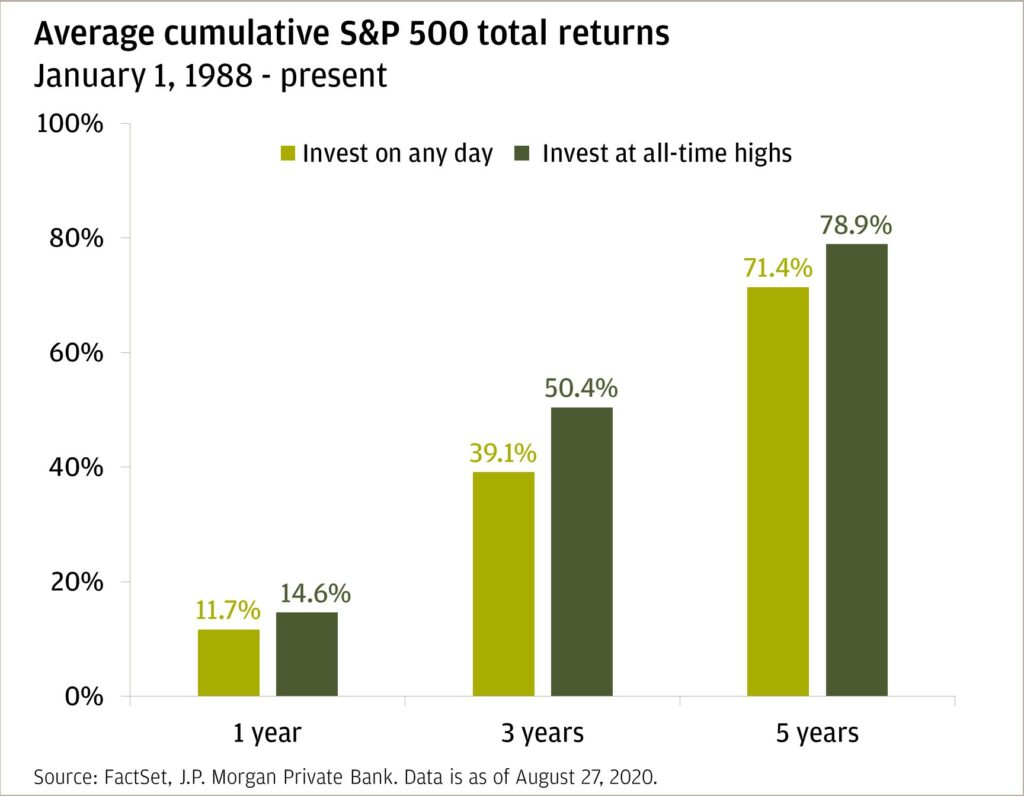
…versus buying the dip
Investors might be surprised to learn that the 5-year cumulative returns after declines in the stock market (buying the dip) are lower than the cumulative 5-year return after the market sets new highs.
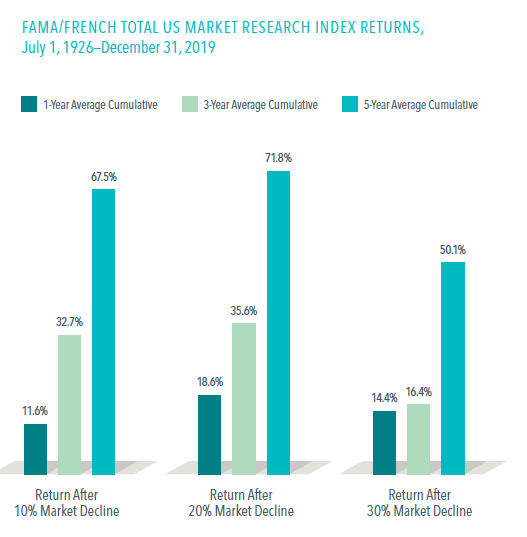
This isn’t an apples-to-apples comparison as the Fama/French Total US Stock Market Index is an expanded representation of the entire US equity market and the chart below is over a much longer time period. However, since the S&P 500 generally represents 80%-85% of the whole US stock market, it’s still a helpful basis for comparison.
Market timing doesn’t work because there’s no telling what markets will do
Rally leading up to the Covid-19 selloff and subsequent rebound
In 2019, the S&P 500 was up nearly 31.5% on a total return basis. That’s over three times the average annualized return for the index since 1926. Nowhere to go but down in 2020, right? Wrong. Despite the Covid-19 pandemic, the S&P 500 was off to a strong start in early 2020. After peaking on February 19th, stocks began to fall sharply and would eventually bottom on March 23rd, down about -30% on the year including dividends. Yet by the end of 2020, the S&P 500 had set 33 new record highs, finishing the year with an 18.4% total return.
Over the course of two years, the index returned over 55% cumulatively. If you bought stocks at the February 19th peak, it would take you until August 10th to break even (the S&P 500 hit a new all-time high on August 18th) and you’d be up nearly 13% by the end of the year.
The 2008 financial crisis
The markets don’t typically recover as quickly as they did in 2020. The S&P 500 peaked October 11th, 2007 before the Great Financial Crisis. If you invested in the index at the high, it would take nearly four and a half years to recoup your losses and another year before the S&P 500 would hit another new high in April 2013. Your cumulative return during this five-and-a-half-year span would be 14%.
Investing is about time in the market, not timing the market
Unless you have a crystal ball, there’s no way to predict how the market may move in the short term. But historical data can provide helpful context to set a range of likely outcomes for the future. It’s called mean reversion.
Using this long-term lens, there are 3 important factors to keep in mind when investing in the financial markets.
1. History shows as the number of years you stay invested increases, the risk of losing money decreases.
This is why we call it long-term investing. As the examples above illustrate, over time, the stock market has trended upward over the last 95 years. However, over the span of several months to years, anything can happen. Regardless of whether you invest when the market is high or low, you shouldn’t pay too much attention to your returns in the short-term.
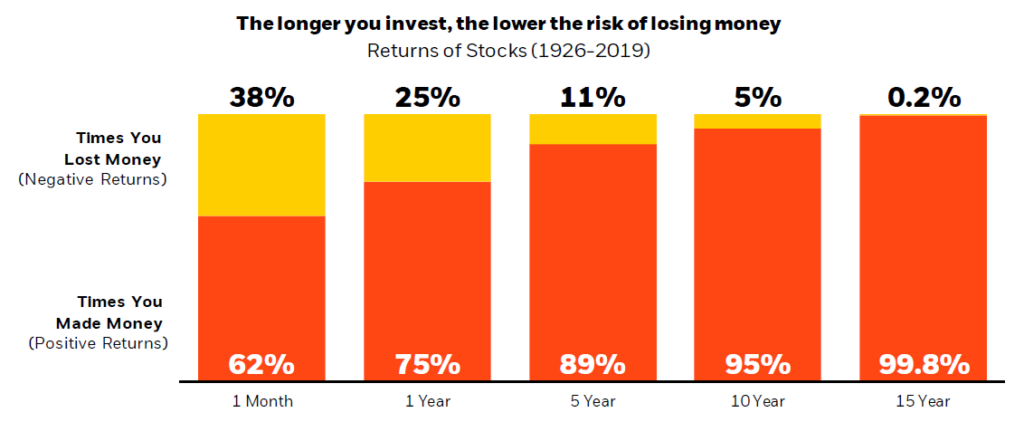
US Stocks represented by S&P 500 and the IA SBBI US Lrg Cap Index. Past performance is no guarantee of future results. This is for illustrative purposes only and not indicative of any investment. It is not possible to invest directly in an index.
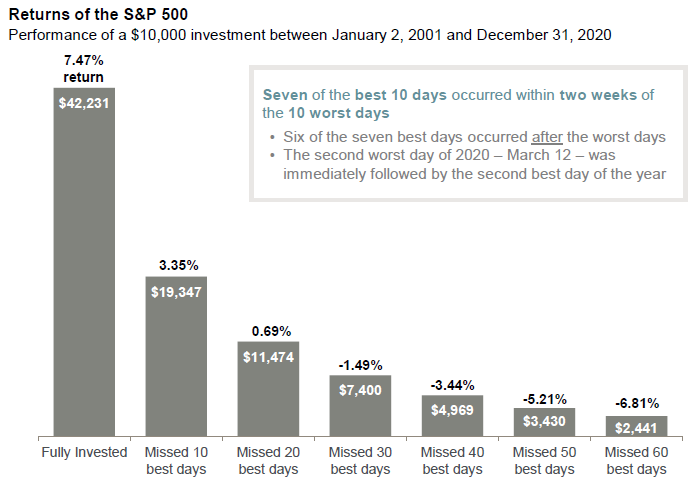
2. In the last 20 years, 70% of the best days in the market happened within 14 days of the worst ones.
You can’t get one without the other. But if you try to time it, it can cost you dearly. So if you’re afraid to invest because the market is up or down, consider the cost of missing the best days. Deciding whether or not it’s a good time to invest shouldn’t have much to do with recent market conditions.
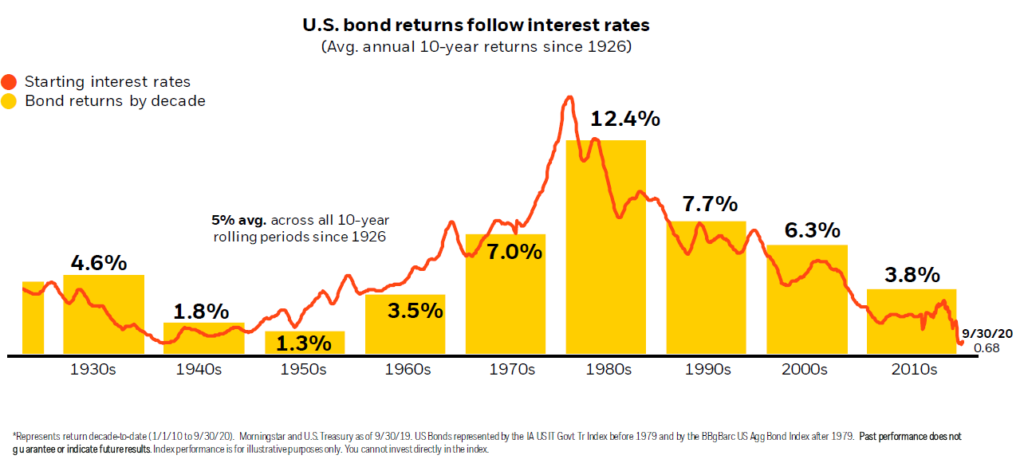
3. What’s the alternative? Bonds and cash aren’t investments for growth.
If you’re concerned about stock valuations and are hesitant to invest, what options do you have to put cash to work? Interest rates have been falling for decades, which has hurt bond returns. Rates on savings accounts are minimal, so staying in cash often means missing out. And keep in mind – many stocks pay dividends. The income can help offset losses when stock prices fall.
Also consider if the market doesn’t fall as fast or sharp as you’re predicting. How much time will you let pass before investing? The risk is that you’ve missed out on growth and end up investing cash when valuations are even higher.
Ways to reduce the risk of investing at the ‘wrong’ time
Dollar-cost averaging
Whether investing during a recession or high-flying stock market, dollar-cost averaging can be an effective way to reduce the risk—and fear—of investing at the wrong time. Unlike trying to time the market, with dollar-cost averaging, you invest at predetermined intervals, regardless of whether the market is high (or low) on that particular day.
In personal finance, it’s not always about what makes sense on paper. Managing the emotional response (e.g. sleeping at night) is a valid concern, though not without limit. Dollar-cost averaging can be an effective strategy in volatile markets or when you have a large amount of cash to invest. Just make sure you set your investment plan in advance and stick to it.
Think outside the S&P 500
Diversify, diversify, diversify! The above examples focus on the S&P 500 because it’s familiar for investors. But that doesn’t mean it’s all you should consider investing in. Diversification is the cornerstone of any risk-adjusted strategy to build and protect your assets. This includes thinking outside of the S&P 500. Here’s why.
Asset classes act differently over time and in various market conditions. The risk-reward framework will also vary, as will current valuations. For example, J.P. Morgan reports that the forward price-to-earnings ratio on March 1, 2021 for the S&P 500 was 42% higher than its 20-year average, versus the All Country World Index (ex-US) at 24% higher. Put another way, most equities are expensive on a historical basis right now, but international stocks are less so.
Investing across asset classes (such as stocks and bonds) and within them (such as mid and large cap equity) is key to reducing volatility and asset correlation in your portfolio. It also helps investors reduce the risk of investing a lump sum in the market at once, as asset classes will generally be performing differently at the time of investment.
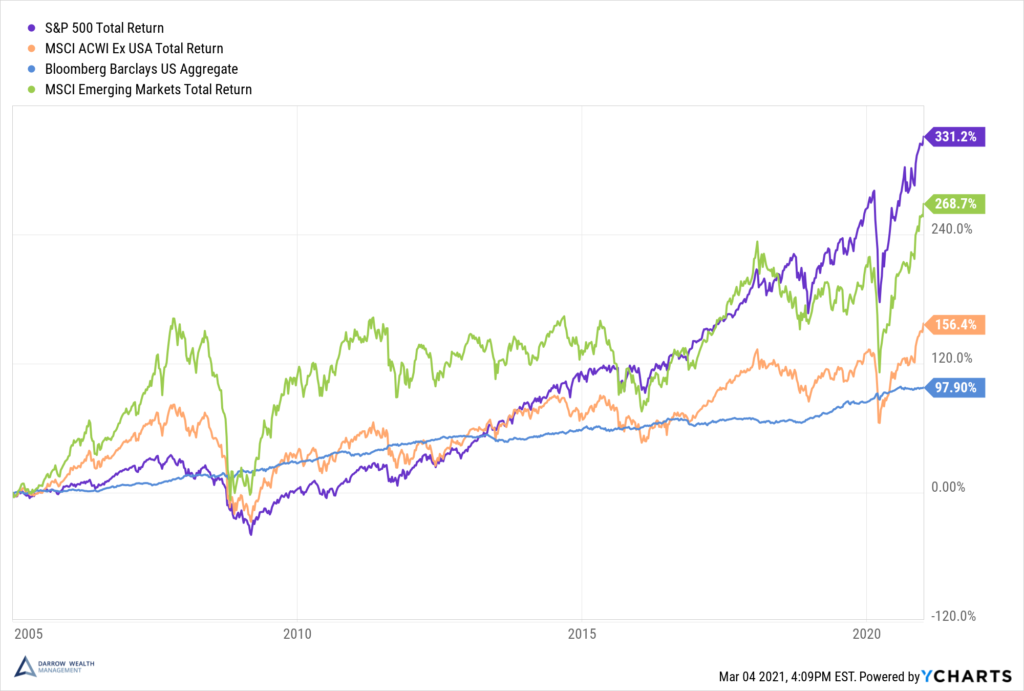
There are many other factors to consider when choosing what to invest in, but the point is that the S&P 500 isn’t the only option. To illustrate how asset classes perform over time and the relative volatility, consider the graph below which shows total returns from 2005 – 2020.
The chart plots the U.S. stock market (S&P 500), U.S. bonds (Bloomberg Barclays Aggregate U.S. bond index), and global equities (MSCI ACWI ex-U.S.) and emerging market equities (MSCI Emerging Markets).
Focus on what you can control
You can’t control the stock market. But you can control how you invest in it and what you do during downturns. A high savings rate, staying invested, and sticking with the plan are critical parts of building and protecting wealth over the long term. Trying to time the market by waiting in cash hoping for a downturn is like leaving your financial future up to chance.
This article was written by Darrow Advisor Kristin McKenna, CFP® and originally published by Forbes.
Disclosures
Examples in this article are generic, hypothetical and for illustration purposes only. Both past performance and yields are not reliable indicators of current and future results. This is a general communication for informational and educational purposes only and not to be misinterpreted as personalized advice or a recommendation for any specific investment product, strategy, or financial decision. This material does not contain sufficient information to support an investment decision and it should not be relied upon by you in evaluating the merits of investing in any securities or products. If you have questions about your personal financial situation, consider speaking with a financial advisor.
¹ All indexes are unmanaged and an individual cannot invest directly in an index. Index returns do not include fees or expenses. Past performance is not indicative of future results.
² Market declines or downturns are defined as periods in which the cumulative return from a peak is –10%, –20%, or –30% or lower. Returns are calculated for the 1-, 3-, and 5-year look-ahead periods beginning the day after the respective downturn thresholds of –10%, –20%, or –30% are exceeded. The bar chart shows the average returns for the 1-, 3-, and 5-year periods following the 10%, 20%, and 30% thresholds. Peak is a new all-time high prior to a downturn. All indexes are unmanaged and an individual cannot invest directly in an index. Index returns do not include fees or expenses. Past performance is not indicative of future results.