
What’s happening in the stock market today? Is the recession over?
Here are 5 charts to help explain what’s going on in the stock market and the economy these days.
How long does it take for the stock market and economy to recover after a recession?
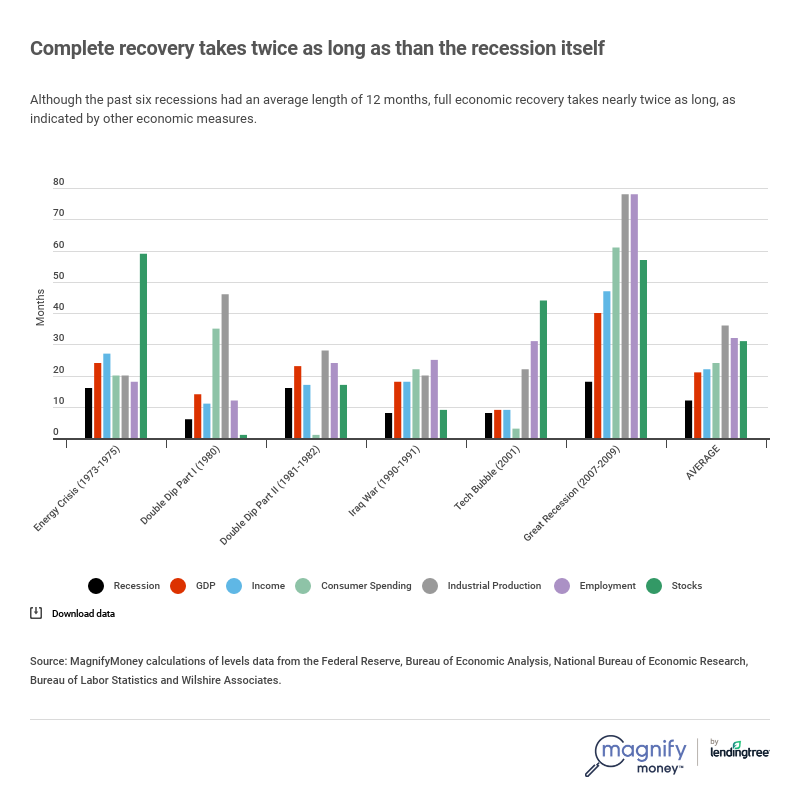
How long has it taken various elements of the economy to recover after the last six recessions?
There’s a lot of talk about the disconnect between the stock market and the economy, and how this recession is different. While both these statements are true, they’re also largely true of every recession.
On average, over the last six recessions, industrial production took the longest to fully recover, averaging 36 months. Employment took the second longest at 32 months. Stocks take around 31 months on average though history shows the recovery can be either almost immediate or spanning several years.
Key economic indicators for the 2020 recession recovery-in-progress
Advance Retail and Food Sales
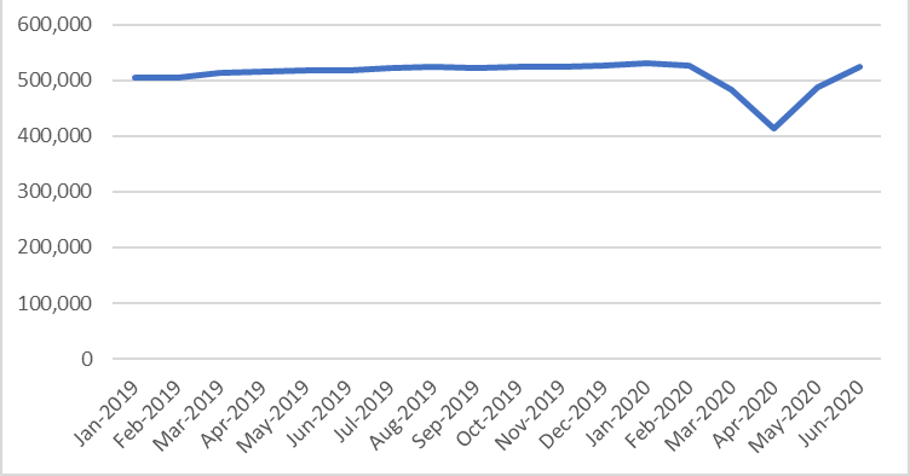
Source: U.S. Census Bureau; Darrow Wealth Management
U.S. Unemployment Rate
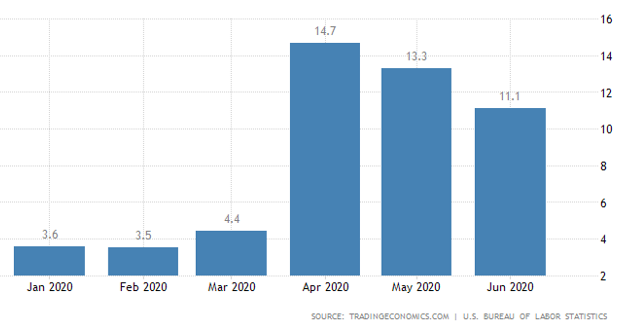
Source: TradingEconomics.com
S&P 500
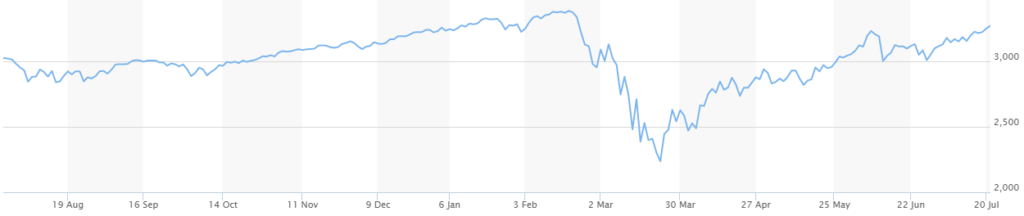
Source: MarketWatch
Advance Manufacturers Orders
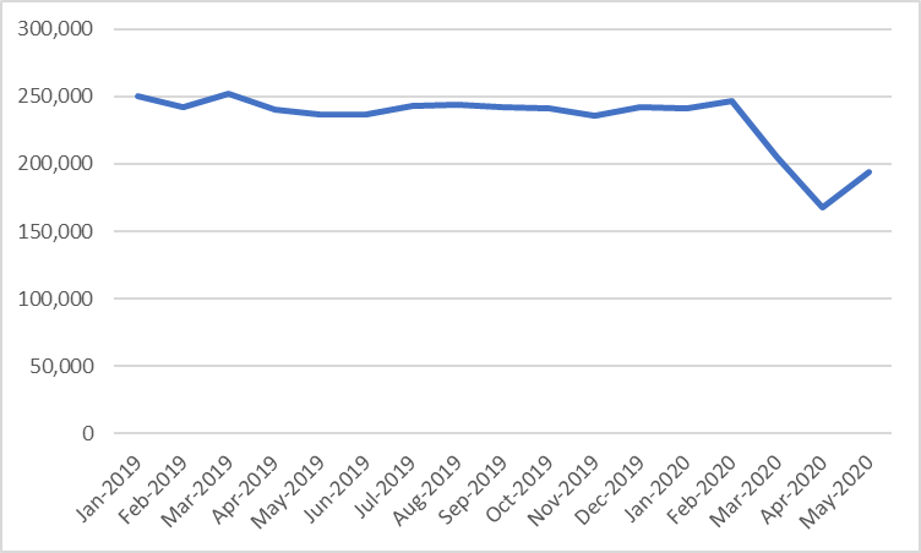
Source: U.S. Census Bureau; Darrow Wealth Management
Not unlike past recessions, the stock market has rebounded quickly along with consumer spending. Employment has a long way to go but manufacturing orders is making headway.
S&P 500 Dividend Yield vs 10-Year Treasury
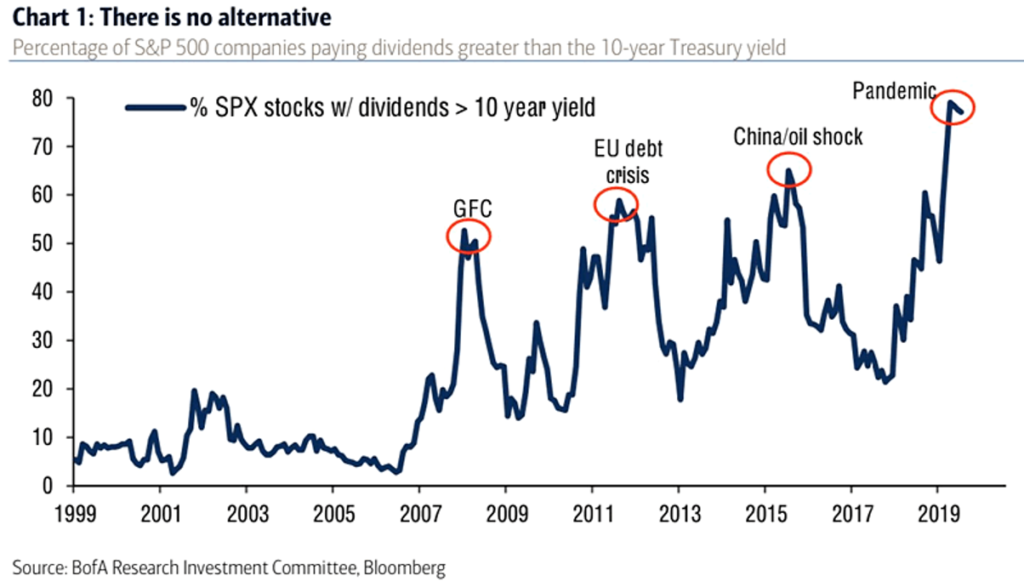
Source: ISABELNET
Above is the percentage of companies in the S&P 500 paying dividends greater than the yield on the 10-year treasury. With bond yields so low, investors in search of income may need to look away from bonds or stick with riskier assets like stocks to meet their needs. This is one reason the selloff in the stock market wasn’t as severe as it could have been given the global economic system was forced into a long pause.
S&P 500 Annualized 10-Year Returns
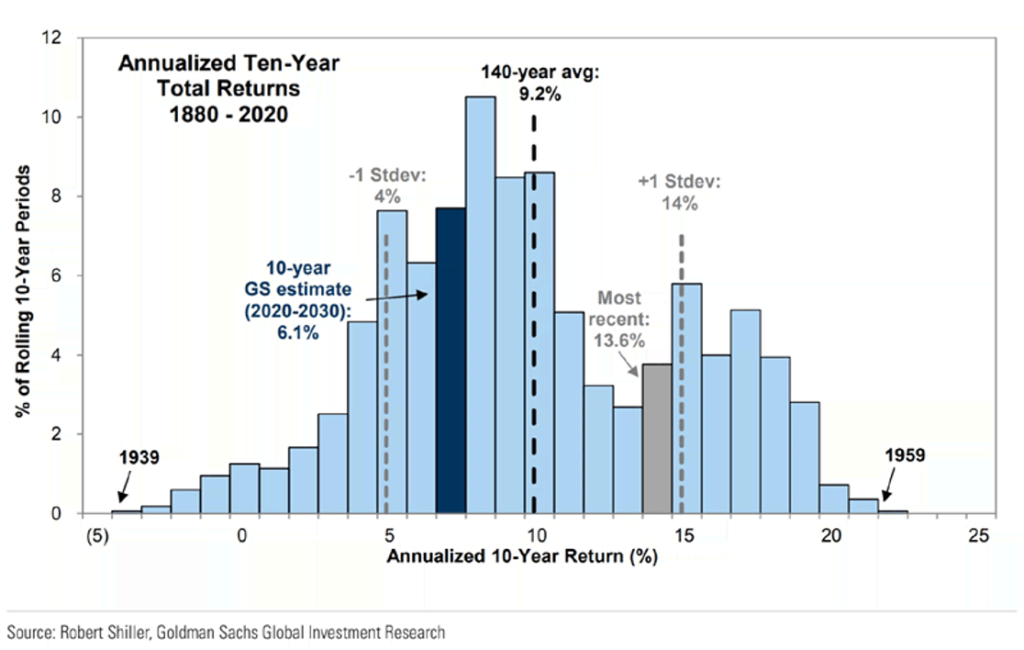
Source: ISABELNET
Now the distribution of annualized 10-year returns for the S&P 500 since 1880. As you might expect given the historic bull market before the pandemic, the most recent annualized 10-year returns were higher than the 9.2% average. Note how infrequently negative 10-year annualized returns have occurred; an important point for long-term investors who often benefit from time in the market versus timing the market.
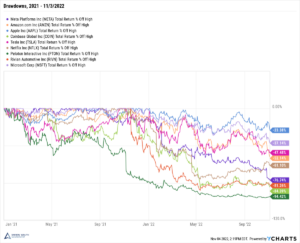
S&P 500 Top 5 Stocks by Market Cap
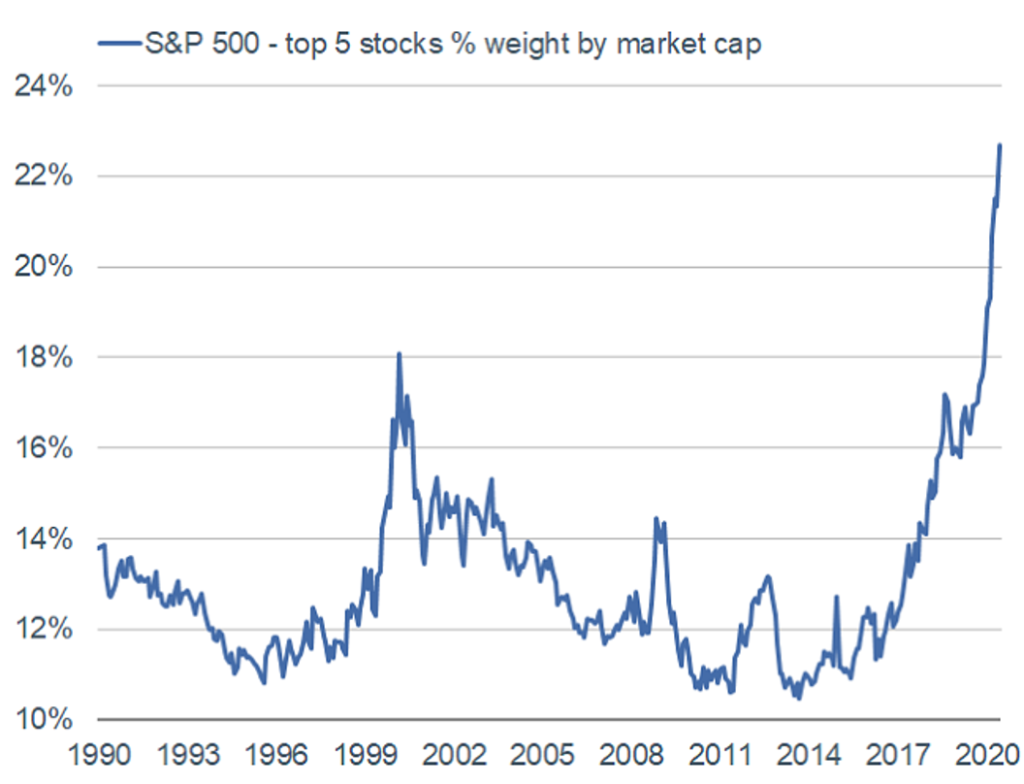
Source: Charles Schwab
The top five stocks in the S&P 500 by market capitalization now make up 22% of the market value of the index. You’re familiar with the names: Microsoft, Apple, Amazon, Facebook, and Alphabet (Google). These big names have been carrying much of the U.S. stock market so far this year.
Of course, there’s no guarantee this outperformance will last forever which is why diversification is key. Consider General Electric, once a revered U.S. brand, was delisted from the DIJA in 2018.
Past performance is not indicative of future results. This material is for informational purposes only and should not be misconstrued as the rendering of personalized investment, legal, tax, accounting, or financial advice.