
No one knows when the U.S. will enter a recession again. And this is precisely why it’s important to always be prepared for an economic or market downturn rather than try and predict it. Investors may be surprised to learn that in the last 69 years, on average, stocks did worse in the year before a recession began than during the recession itself. Here’s how the S&P 500 performed before, during, and after past recessions.
Performance of the S&P 500 before, during, and after recessions
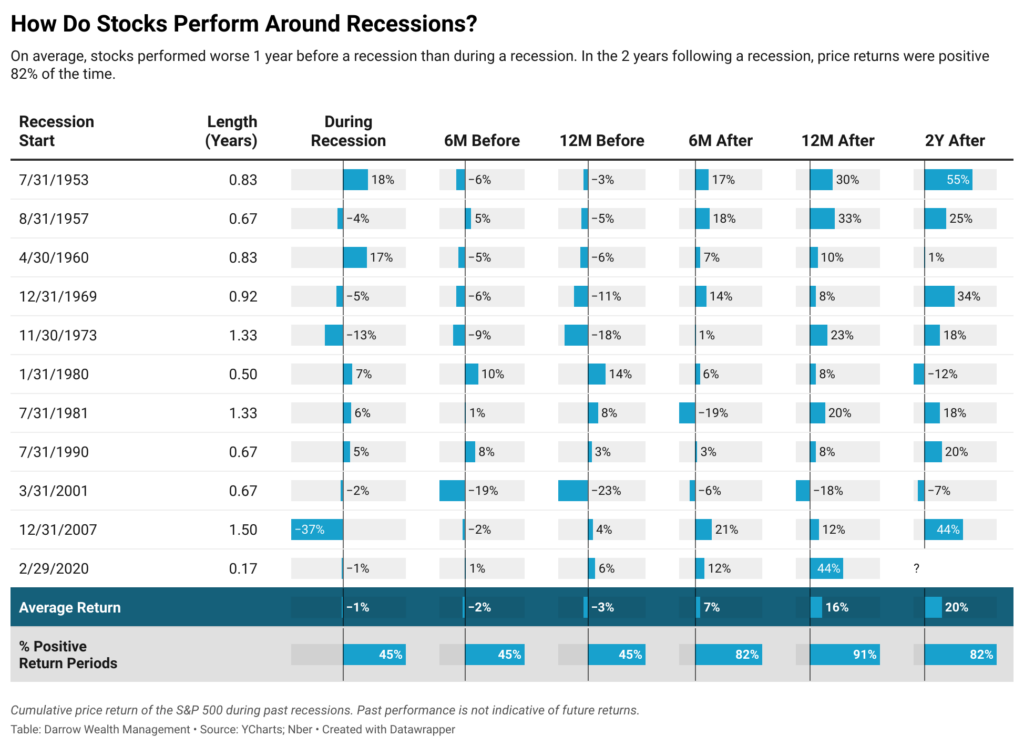
There are several key takeaways from the chart above (which only included recessions since the 1950s as provided by NBER):
- Length. In the 11 recessions since 1953, the average length was 10.3 months. The Covid recession only lasted two months while the 2008 Great Financial Crisis was almost twice the average.
- Before and during recessions. The cumulative price return for the S&P 500 was, on average, lowest in the year leading up to a recession (-3%), followed by six months before (-2%), versus an average loss of 1% during a recession. Further, across all three periods, returns were positive nearly half the time. Remember, markets look ahead while economic data looks behind.
- After recessions. It should not come as a surprise that cumulative returns grow increasingly positive the farther out you go after a recession. After all, stocks tend to go up more than down. And the longer you stay invested, the less likely you are to lose money. The instances of positive returns almost doubles.
- Each time is different. History is a helpful guide but it’s not a way to predict the future. The 1980 recession ended just a year before the 1981 recession started. The implications are evident the figures above. Similarly, the GFC in 2008-2009 was by far the worst for stocks during a recession, and the outperformance one year after the Covid crash was also an outlier. Even despite the year-to-date pullback, cumulatively, the S&P 500 is up over 59% since the 2020 recession ended in May 2020 (nearly 64% if you include dividends!).¹
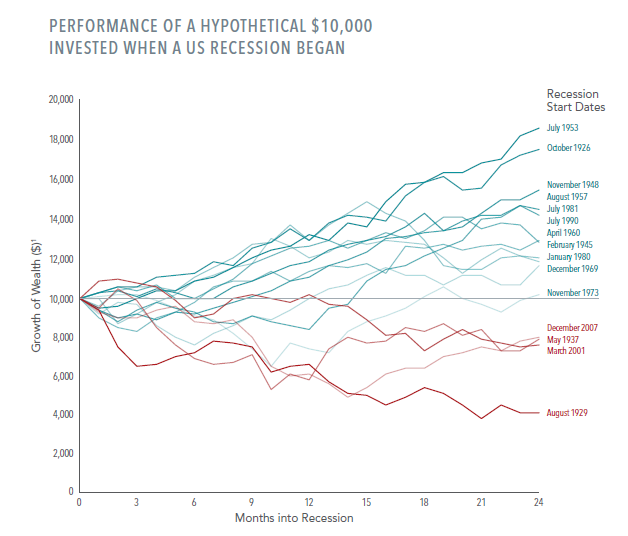
Stock market returns 2 years after the start of a recession
In the table above, we looked at how stocks performed after a recession ended. Dimensional Fund Advisors created the following graphic to illustrate the performance of the Fama/French Total US Market Research Index 24 months after a recession first began. Consistent with the table above, recovery times and strength varies, but positive performance has historically been the more likely outcome.
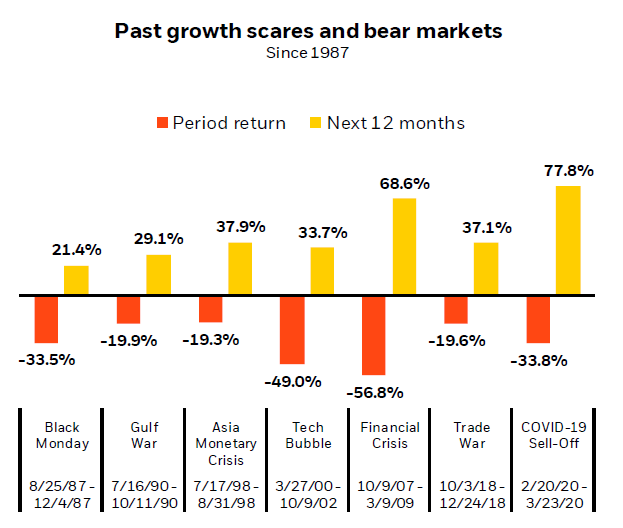
Markets can fall without a recession
Remember, the stock market is not the economy. There can be pain in one without infecting the other. Consider the chart below. Black Monday, the Asia Monetary Crisis, and 2018 Trade War did not meet the definition of a recession per NBER. But in all instances, from the market bottom, returns were positive after 12 months.
The takeaway: investors cannot predict what markets may do before, during, and after a recession. How stocks perform at any given time depends on many factors. So it’s important to take steps to help prevent an economic downturn from having an outsized impact on your financial goals.
This article was written by Darrow Advisor Kristin McKenna, CFP® and originally appeared on Forbes.
Disclosures
Examples in this article are generic, hypothetical and for illustration purposes only. Both past performance and yields are not reliable indicators of current and future results. This is a general communication for informational and educational purposes only and not to be misinterpreted as personalized advice or a recommendation for any specific investment product, strategy, or financial decision. This material does not contain sufficient information to support an investment decision and it should not be relied upon by you in evaluating the merits of investing in any securities or products. If you have questions about your personal financial situation, consider speaking with a financial advisor.
All indexes are unmanaged and an individual cannot invest directly in an index. Index returns do not include fees or expenses. Past performance is not indicative of future results.
¹ To March 29th, 2022