
Stocks and bonds differ in many aspects, including the risk and return investors can expect. Because of these differences, stocks and bonds accomplish different things in an asset allocation. When you own a stock, you’re buying a piece of equity ownership in the company. With bonds, you’re buying the issuer’s debt. Stocks have unlimited growth potential but also more volatility. Bonds, however, are more stable investments that provide income, but have much less upside. Bonds are also less risky than stocks because in the event of bankruptcy, bondholders will get repaid first. Stockholders are last in line and usually get nothing.
Because of the different risk and return profiles, there are benefits of holding stocks and bonds, it’s not usually an either or. They both have a place, though in different weightings, which change over time. Since bonds traditionally offer stability and income, but not much growth, equities are key to help investors keep pace with inflation over the long-term.
Bond Basics: How Bonds Work and Reasons to Add Bonds to Your Portfolio
Key differences between stocks and bonds
- Stocks represent equity ownership while bonds are debt investments, representing the borrower’s commitment to repaying that loan with interest over time
- Unlike stocks, which are issued by corporations, fixed income issuers are primarily governments
- Stocks produce returns primarily in the form of stock price appreciation, though companies can also pay dividends. Bonds don’t offer much upside in terms of price appreciation, but fixed coupon payments can provide a stable income stream for investors
- The bond market is very sensitive to changes in interest rates, while the stock market is more sensitive to economic inputs like consumer spending and changes in policy that may affect businesses, such as tax policy
Stock vs bond returns
Investors don’t hold bonds to outperform stocks over the long run. That’s not their job. Bonds offer more stability than stocks, and in exchange for less volatility, bond investors are willing to sacrifice some of the upside they might get with equity.
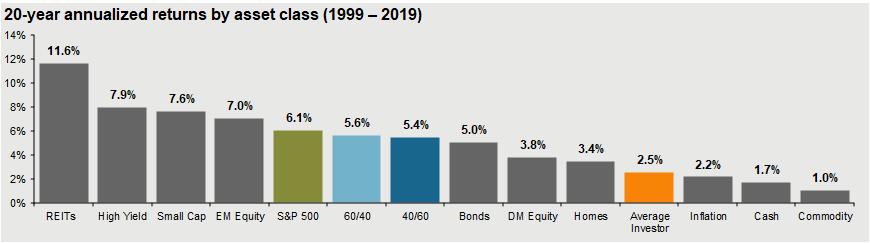
20-year annualized returns of stocks, bonds, and other asset classes
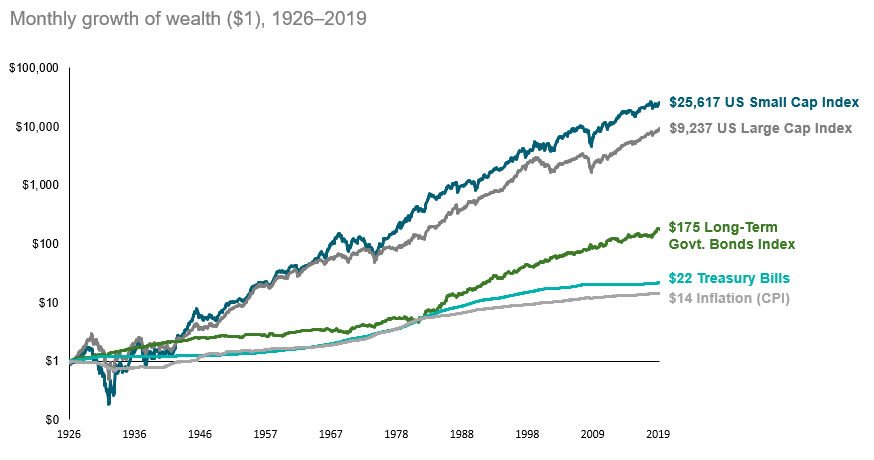
Long-term growth of $1: stocks vs bonds vs inflation
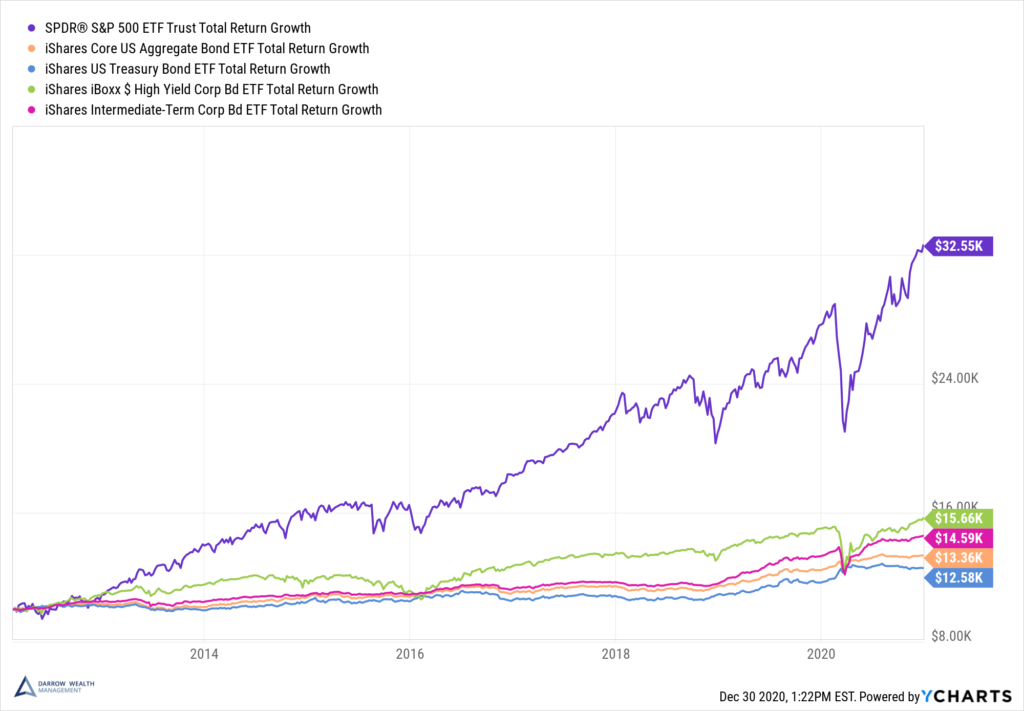
Medium term growth of $10,000: S&P 500 vs bonds
If you invested $10,000 in 2012 in various bond funds vs the S&P 500, what would your total returns be today? We expect stocks to do produce higher returns over long periods of time. We also expect safer fixed income sectors like Treasuries not to do as well as riskier parts of the bond market, like high yield bonds, or ‘junk’ bonds.
Fixed income vs equity risk: bonds can help mitigate volatile equity investments, especially in the short-term
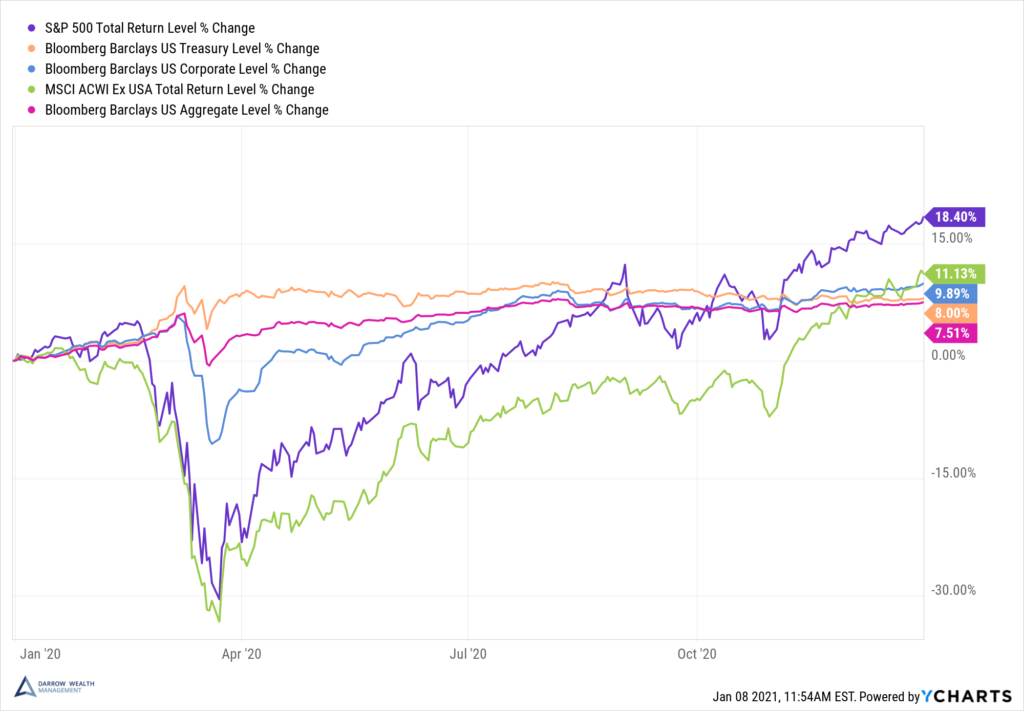
Performance of stocks vs bonds during the market downturn following the Covid-19 outbreak in 2020
During the initial market reaction to the Coronavirus pandemic, both equity and fixed income assets suffered. However, bonds didn’t decline nearly as much as stocks did. This relationship has played out in past recessions as well, including 2008.
Here’s the normalized percentage change in 2020 for various stock and bond indices. It wasn’t until the end of August that the S&P 500 overtook U.S. Treasuries for year-to-date performance. Even then, the stock index still waivered versus bonds until early November. After the election, it was off to the races.
Stock vs bond volatility over time
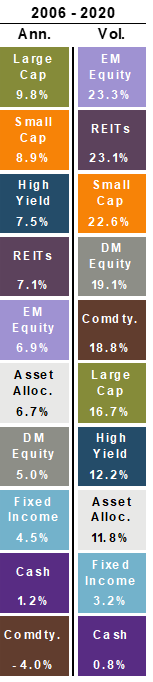
The chart on the left¹ highlights the annualized returns (column on left) and volatility (right column) between 2006 – 2020. Large cap equity is the S&P 500 while fixed income represents the U.S. aggregate bond market and cash is short-term Treasuries (1-3 month).
During this time, stocks performed twice as well as bonds but they were over four times as volatile. Investors, particularly retirees and those on the cusp of retirement, should really care about volatility.
A $1M starting account with no contributions or withdrawals has a return of +20% or -20% each year for 20 years. The average return is 0% but the compound average growth rate is -2%. Accordingly, the account isn’t worth $0 at the end of 20 years, it’s actually worth $665,000. This is known as volatility drag, and it explains how wild swings in the stock market can erode your assets.
Put another way, if you lost -20% one day, you’d need a +25% gain the next day to break even. This is why it typically takes three years for the market to recover after a bear market.
The diversification bonds can provide by adding safety to a portfolio is one of the main reasons investors use equity and fixed income in their financial plans.
What Are Negative-Yielding Bonds?
Stocks and bonds react differently to changing market conditions
Diversification comes in many forms. Utilizing asset classes that aren’t perfectly correlated helps provide protection as securities in a portfolio respond differently to changing market conditions. The principles of diversification support investing in both stocks and bonds.
Correlations shift over time and within an asset class itself. As of December 2020, J.P. Morgan reports the correlation between the S&P 500 and the Bloomberg Barclays Aggregate (the benchmark for the U.S. bond market) is -.20.
A correlation of 1.0 means the assets are perfectly correlated and will move in tandem. A -1.0 correlation means the assets are perfectly negatively correlated, so as one asset moves in one direction, the other will move by the same amount, but in the opposite direction. A correlation of 0 means the assets have no relationship and move independently from one another.
How Do Interest Rates Affect Bond Returns?
A correlation of -.20 means the U.S. stock and bond benchmarks are slightly negatively correlated. But remember, there are other types of bonds. The 2-year Treasury has a -.39 correlation with the S&P 500, which makes sense as treasuries are among the safest assets. When the stock market experiences volatility, investors flock to safety. Corporate bonds, on the other hand, have a .39 correlation with the S&P 500, meaning these asset classes tend to move together, just not in the same magnitude.
Why you should consider both stocks and bonds in your portfolio
Imagine it’s January 2007 and you invest in the S&P 500 (SPY). By the end of 2009, your total loss is a little more than -16%. If you put 70% of the money in the S&P 500 and 30% in bonds (Bloomberg Barclays Aggregate – AGG), the total loss would be cut to -5.7%. If you only had 10% invested in bonds, your loss would be roughly -12.6% while a 50/50 portfolio would actually have a 1.2% gain. Why add bonds to your portfolio? Because bonds can help hedge your risk.
These allocations are simply to illustrate the point. Investors have different needs, risk tolerances, time horizons, and financial situations which require a custom asset allocation. While bonds can help limit portfolio drawdowns, they also limit investment gains.
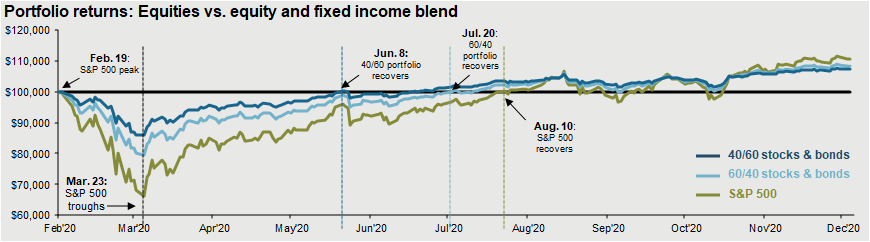
How a blend of stocks and bonds could help reduce investment risk during the Covid-19 crisis
Remember, you can’t always plan for a stock market crash. So if you wait to diversify until after something happens, it’s probably too late. Here’s how a blend of stocks and bonds could help an investor reduce risk during volatile periods in the markets.
Help managing your investments
There’s a lot to keep in mind as you build a diversified portfolio. Consider working with a fiduciary financial advisor to help manage your investments and provide financial planning guidance before and during retirement. After all, investment management is an ongoing process.
Over the long term, as your life changes, you’ll need to consider whether your weightings in stocks vs bonds is appropriate. As economic conditions and income needs change, so too will your asset allocation.
If you’re self-managing your money, consider whether it’s worth it to work with an investment advisor to help ensure you are making the most of your financial opportunities. As with any financial decision, you’ll want to make sure it aligns with your overall wealth strategy.
Important Disclosures
All indexes are unmanaged and an individual cannot invest directly in an index. Index returns do not include fees or expenses.
¹Source: J.P. Morgan Asset Management. Large cap: S&P 500, Small cap: Russell 2000, EM Equity: MSCI EME, DM Equity: MSCI EAFE, Commodity: Bloomberg Commodity Index, High Yield: Bloomberg Barclays Global HY Index, Fixed Income: Bloomberg Barclays US Aggregate, REITs: NAREIT Equity REIT Index, Cash: Bloomberg Barclays 1-3m Treasury. The “Asset Allocation” portfolio assumes the following weights: 25% in the S&P 500, 10% in the Russell 2000, 15% in the MSCI EAFE, 5% in the MSCI EME, 25% in the Bloomberg Barclays US Aggregate, 5% in the Bloomberg Barclays 1-3m Treasury, 5% in the Bloomberg Barclays Global High Yield Index, 5% in the Bloomberg Commodity Index and 5% in the NAREIT Equity REIT Index. Balanced portfolio assumes annual rebalancing. Annualized (Ann.) return and volatility (Vol.) represents period from 12/31/05 to 12/31/20. Please see disclosure page at end for index definitions. All data represents total return for stated period. The “Asset Allocation” portfolio is for illustrative purposes only. Past performance is not indicative of future returns. Data are as of December 31, 2020.
Disclosure
Examples in this article are generic, hypothetical and for illustration purposes only. Both past performance and yields are not reliable indicators of current and future results. This is a general communication for informational and educational purposes only and not to be misinterpreted as personalized advice or a recommendation for any specific investment product, strategy, or financial decision. This material does not contain sufficient information to support an investment decision and it should not be relied upon by you in evaluating the merits of investing in any securities or products. If you have questions about your personal financial situation, consider speaking with a financial advisor.