
What happens if…? That’s the million-dollar question. Stress testing a financial plan and retirement projections can help investors feel more confident in the likelihood they won’t run out of money under different conditions in the financial markets. To illustrate why investors need a robust financial model, consider this typical scenario: an individual signs into their 401(k) or Googles ‘retirement calculator’ and enters several simplistic assumptions, such as their expected rate of return, inflation rate, current asset level, and annual contribution rate.
In a few seconds, the calculator spits out a chart (that only goes up) and a projected portfolio balance at retirement. Viola: retirement, planned. Right?
Not so fast.
Testing the probability of achieving your desired retirement income
The situation above isn’t inherently flawed—these quick calculators can be helpful to get a sense of where you might stand under ideal conditions. However, if you never engage a financial planner how will you know if your retirement plan can survive different market cycles?
Stress testing a financial plan using simulations can find the probability of outcomes over a long-term plan. But even holistic modeling won’t guarantee that the timing and severity of short-term disruptions won’t derail some financial goals.
For example, if you suffer a job loss or a sharp decline in the stock market right before you plan to retire, you might need to hold off for a time. We can test the sequence risk on a portfolio—how timing impacts the outcome—but major financial decisions require a data check and a gut check.
Do You Need a Financial Plan or Financial Planning?
How often is the S&P 500’s annual return equal to the average return?
Not very often.
The average annualized return for the S&P 500 is about 9% between 1980 – 2019. Yet, over 40 years, the index only produced a 9% return once during this time. The actual return is typically much higher or considerably lower.
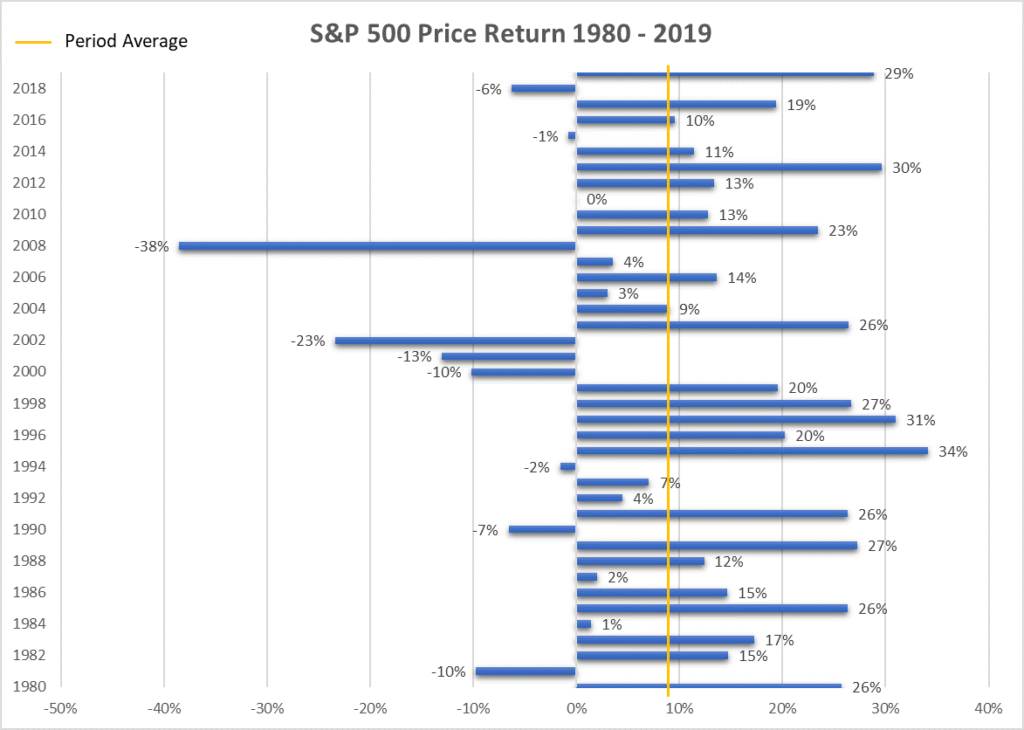
With a traditional investment return calculator, if you enter a 9% return, you’ll likely get an artificially optimistic outcome. Why? The variability of returns and cash flows, among other factors, matters a lot.
Straight line calculators don’t account for the variability in investment returns or the timing of down years. The only factor is a static average annual return. Significantly, these basic compounded return calculators only assume your investment account will grow. They ignore the other half of the equation that produced the average.
Here’s an example to illustrate the dangers of relying on simple retirement projections to determine your financial future:
As I show in this analysis for Forbes, a couple maxing out their 401(k)s from age 35 to 65 are likely to attain a safe retirement income of $65,000 annually, increasing by inflation. Why not more? Because we ran a Monte Carlo simulation, which more accurately reflects market moves.
Running the same analysis but using static returns, with no deviation to account for down years – and there will be down years, the couple would think they could spend $100,000 per year. At this level of spending, there’s a 50% chance they’d run out of money during retirement under normal market conditions. Not ideal.
Average returns ignore market moves
To show how volatility can impact your investments, consider the following example.
A $1M starting account with no contributions or withdrawals has a return of +20% or -20% each year for 20 years. The average return is 0% but the compound average growth rate is -2%. Accordingly, the account isn’t worth $0 at the end of 20 years, it’s actually worth $665,000.
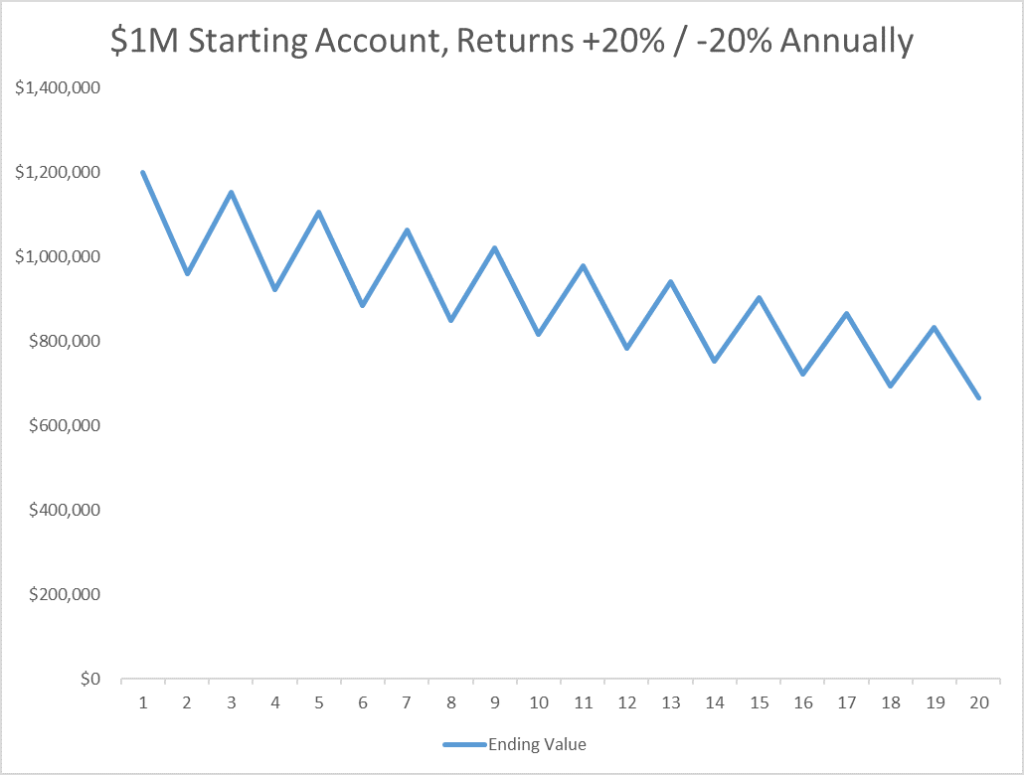
This is called volatility drag, and it explains how wild swings in the stock market can drag your investments down.
Simply, if you lost -20% one day, you’d need a +25% gain the next day to break even. This is why it typically takes three years for the market to recover after a bear market.
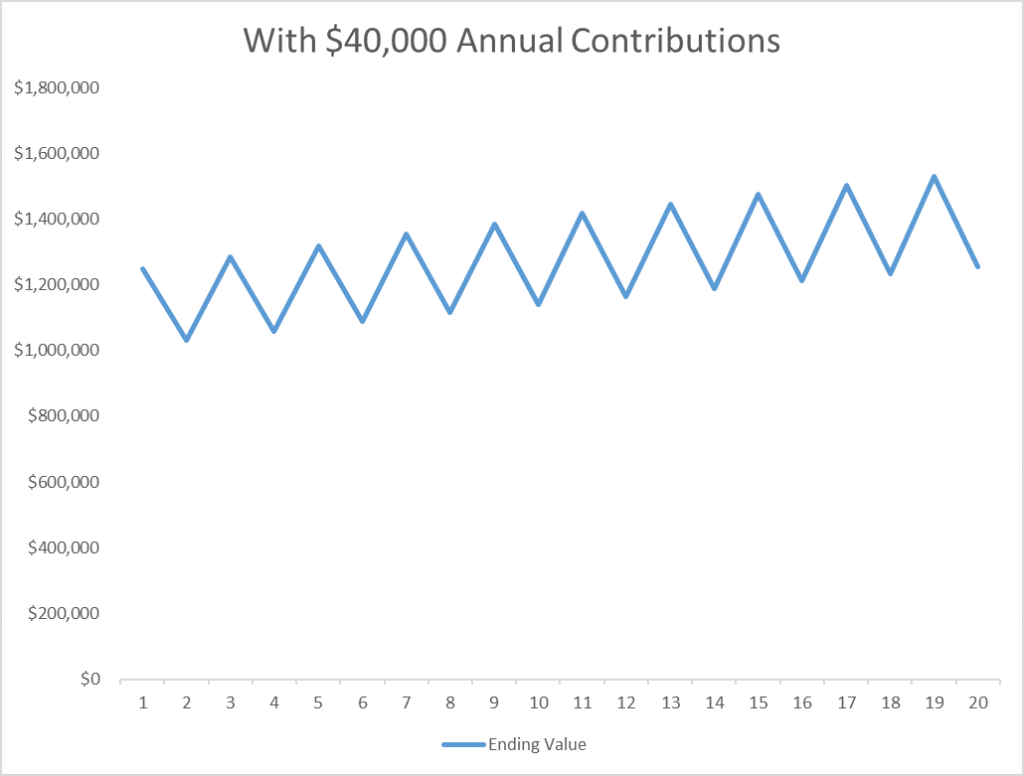
Cash flows exacerbate the impact of a market downturn
Following on the previous example, now assume an investor contributes $40,000 per year for 20 years. The $1M portfolio has grown to $1.25M by the end of year 20, equaling a compound average growth rate (CAGR) of 1.14%.
$1M starting account with annual returns +20% / -20% and $40,000/year contributions
What if the $40,000 was withdrawn annually from the account instead? By the end of year 20, the account would only be worth $75,000.
$1M starting account with annual returns +20% / -20% and $40,000/year withdrawals

Of course, these are dramatic examples. But it’s helpful to illustrate the impact timing, cash flows, and extreme market swings can have on your ability to reach your financial goals. A downturn before or just after retirement is especially damaging.
Reduce risk in your financial plan with a Monte Carlo simulation
A Monte Carlo analysis is like stress testing a financial plan. It can help reveal the probability of outcomes and reduce risk by producing conservative planning assumptions.
In financial planning, one of the uses of a simulation is to test the viability of a projected income stream in retirement under various market conditions.
Specific parameters are set for the analysis, like how many hundreds of trials to run or specific deficit tolerances for each goal. A deficit tolerance limits the shortfall for each trial before the scenario is considered a failure.
Here’s a simplified example of how this can work:
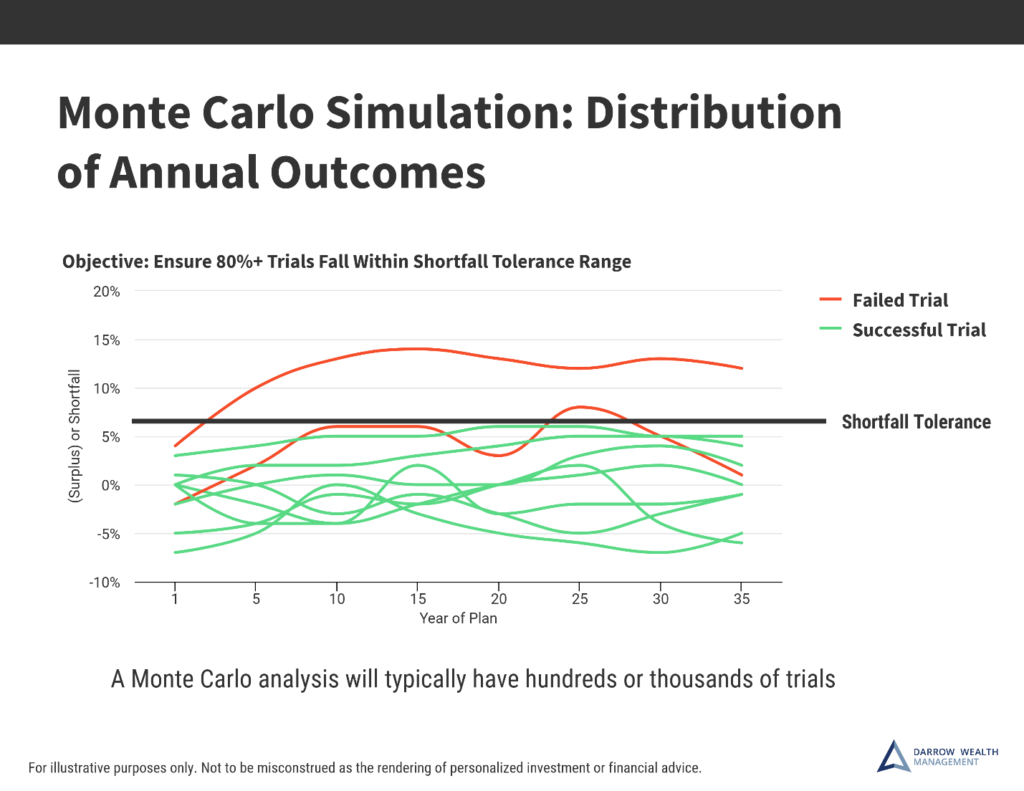
Using the return and standard deviation assumptions for the asset allocation, the analysis accounts for market volatility and the impact on cash flows. This produces a probability of success across all trials.
When there’s an annual surplus or a deficit smaller than the parameters, the trial is a success. Generally, we strive to reach an 80% probability of success or better. This provides a confidence level that a client can achieve their lifestyle goals without running out of money in retirement. The analysis also accounts for the impact of taxes, inflation, and ‘lumpy’ cash flows as income and expenses change.
The results of the planning simulation can be quite dramatic. It’s not unusual to have a baseline success rate of 100% but a probability of success around 60% when accounting for market fluctuations.
This is why a more robust approach to retirement planning is so critical. Comprehensive financial planning with a cash flow analysis and volatility simulation can be a great tool to help give investors piece of mind that their retirement strategy has been tested under all market conditions.
About Darrow Wealth Management
Darrow Wealth Management is an independent fee-only financial advisor and full-time fiduciary. The Darrow Wealth Management Program provides ongoing investment management and financial planning services for individuals and families.