
The Federal Reserve is going to be raising interest rates (via the target Federal Funds rate). This is likely to happen next month. Rising interest rates affect the stock and bond market in different ways. Interest rates don’t have a uniform impact on sectors within each broad asset class, either. Further, as always, there are multiple narratives at play in the financial markets. Each historical example of returns before, during, and after each Fed rate hike was undoubtedly influenced by outside geopolitical and economic factors. While history serves as a helpful reference, it’s clear in the charts below that there’s no pre-determined market reaction or outcome of rising interest rates.
How might your investments react when the Fed raises rates?
In the charts below focus on 3 different rate hike cycles:
- The 1999 – 2000 rate hike cycle when rates were being raised from the low of 4.75%
- The 2004 – 2006 cycle when rates were at 1% during the lows
- The 2015 – 2018 cycle when rates were at 0% following the great financial crisis (rates are currently 0%)
Each example plots the cumulative and annualized total return for the following stock and bond indices over a period of roughly 6 months and normalized to one starting point:
- S&P 500
- Russell 1000 Growth stocks
- Russell 1000 Value stocks
- Bloomberg US Aggregate (primary benchmark for all US investment grade bonds)
- Bloomberg US Corporate (investment grade corporate bonds)
- Bloomberg US Government/Credit 1-3 Year (short-term treasuries)
Asset class performance before the Fed raises rates
Markets are forward-looking. It is impossible to consider the impact of rising interest rates on your investments without acknowledging that a lot of movement has already been priced in before the first increase even happens. Therefore, let’s look at how stocks and bonds have historically performed roughly 6 months before the Fed raised rates.
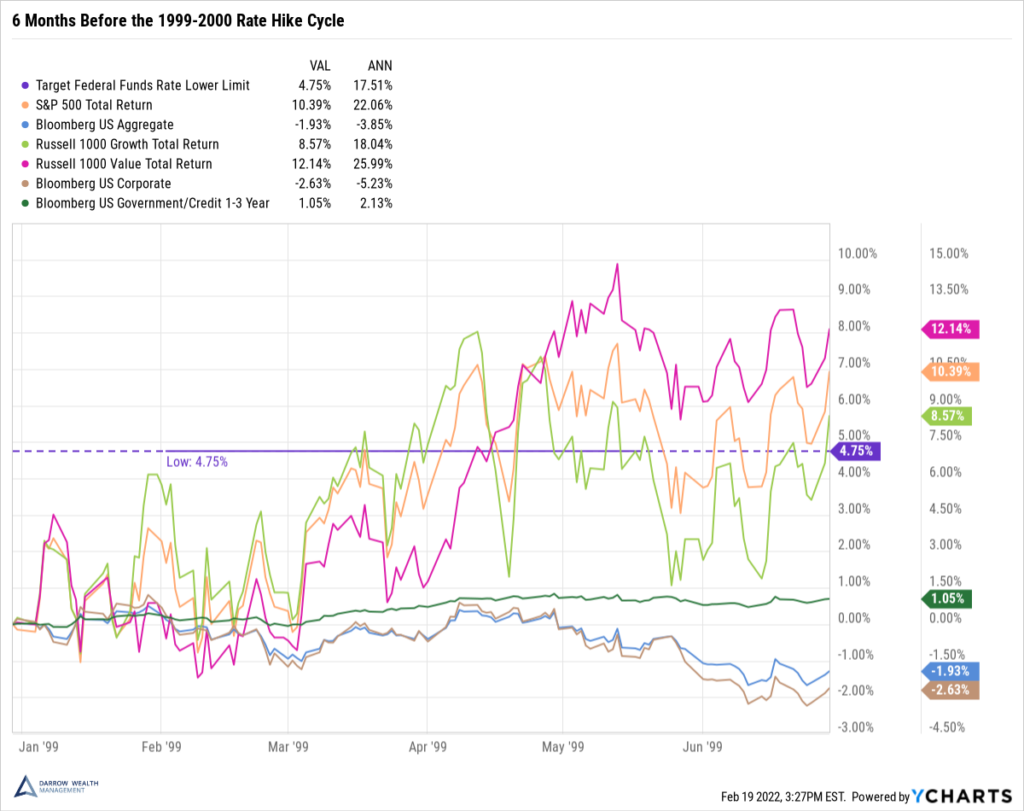
Before the 1999 – 2000 cycle
Stocks: value handily beat growth with the S&P 500 in between. Value stocks tend to be more tied to the economy. A primary reason for an increase in interest rates is due to underlying economic strength: rate hikes are a way to cool runaway economic growth. Bonds: short-term treasuries fared the best and corporate bonds the worst. Assuming a parallel shift in the yield curve (which doesn’t always happen), investment grade corporate bonds would be more affected by increasing interest rates compared to short-term treasuries or the US aggregate index.
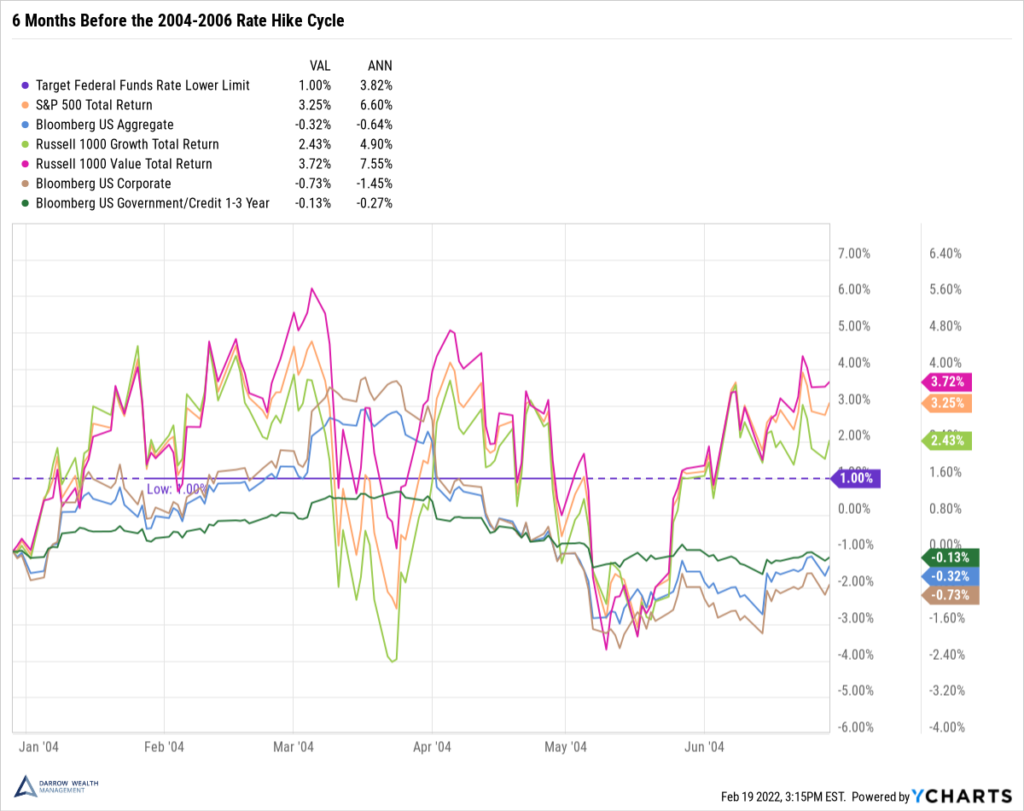
Before the 2004-2006 cycle
Same story all around, though with less dispersion.
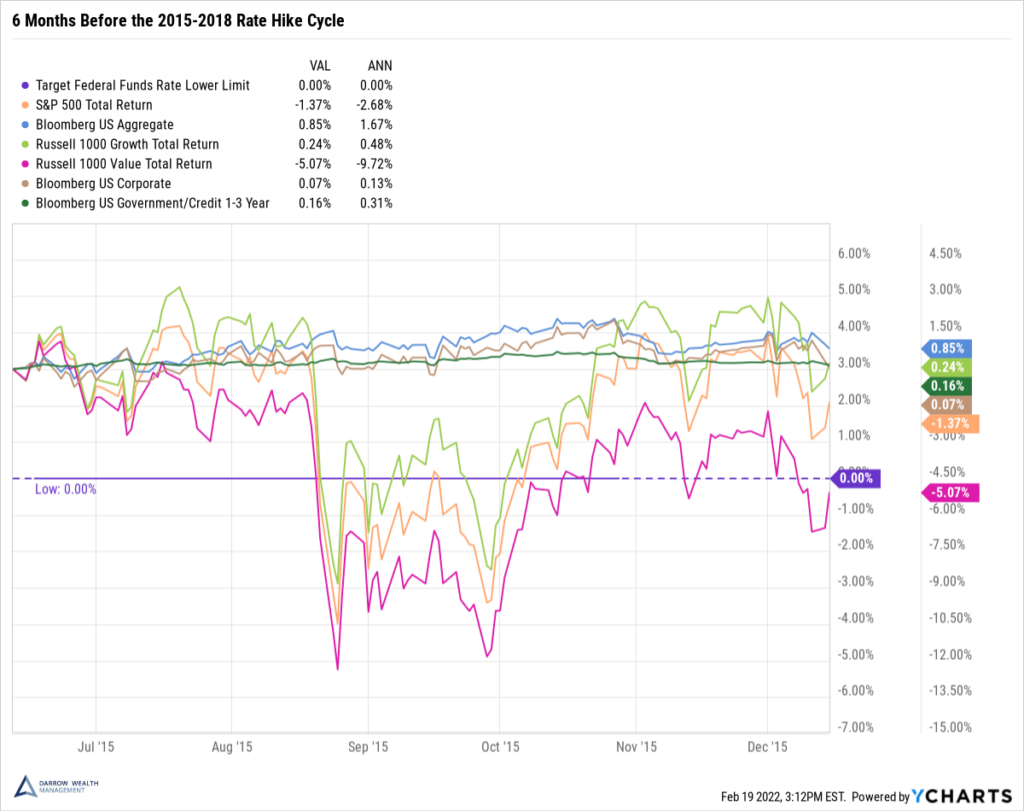
Before the 2015 – 2018 cycle
Very different story. The Bloomberg US Aggregate bond index outperformed all the other asset classes with a return of less than 1%. Value stocks were by far the worst performing in the 6 months leading up to the first interest rate hike. This cycle, the market actually expected the Fed to begin raising rates much earlier than it did. Investors’ concerns about economic health given the hesitancy to raise interest rates, combined with sinking oil prices hurt stocks in 2015, notably value. Again, there are always many other narratives at play (such as concerns about China, strong dollar, weak energy prices, etc.).
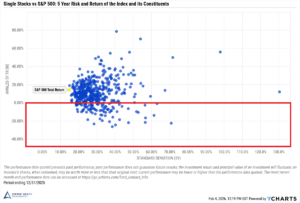
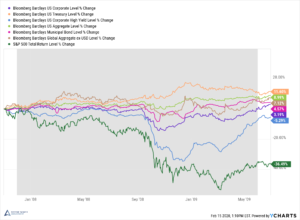
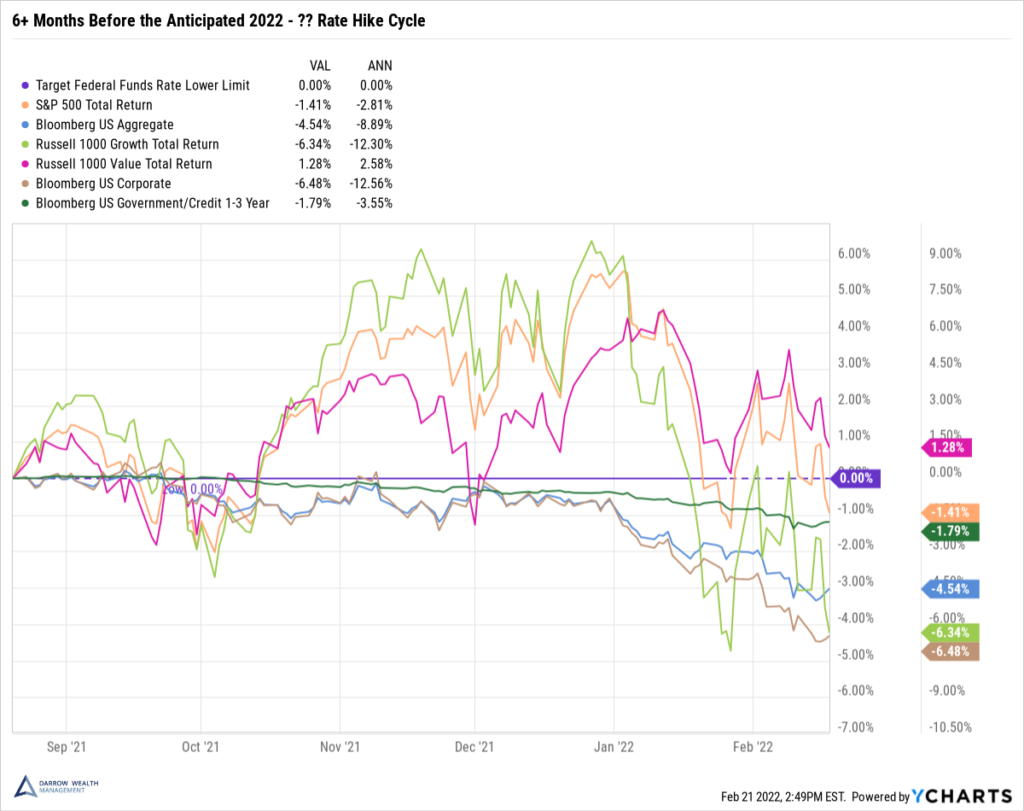
6+ months before the anticipated 2022 – ? rate hike cycle
Though the Fed has yet to raise interest rates, the last 6 months have been choppy for equities and bonds alike. Value stocks are performing the best overall with a small 1.3% cumulative total return. All other sectors are negative, and corporate bonds and growth stocks are the worst underperformers, both down over 6%. Due to multiple factors including asset prices, inflation, fiscal and monetary support, this time is likely to be different, just as every time before now has been.
How do interest rates affect bonds?
Returns of stocks and bonds during rate hike cycles
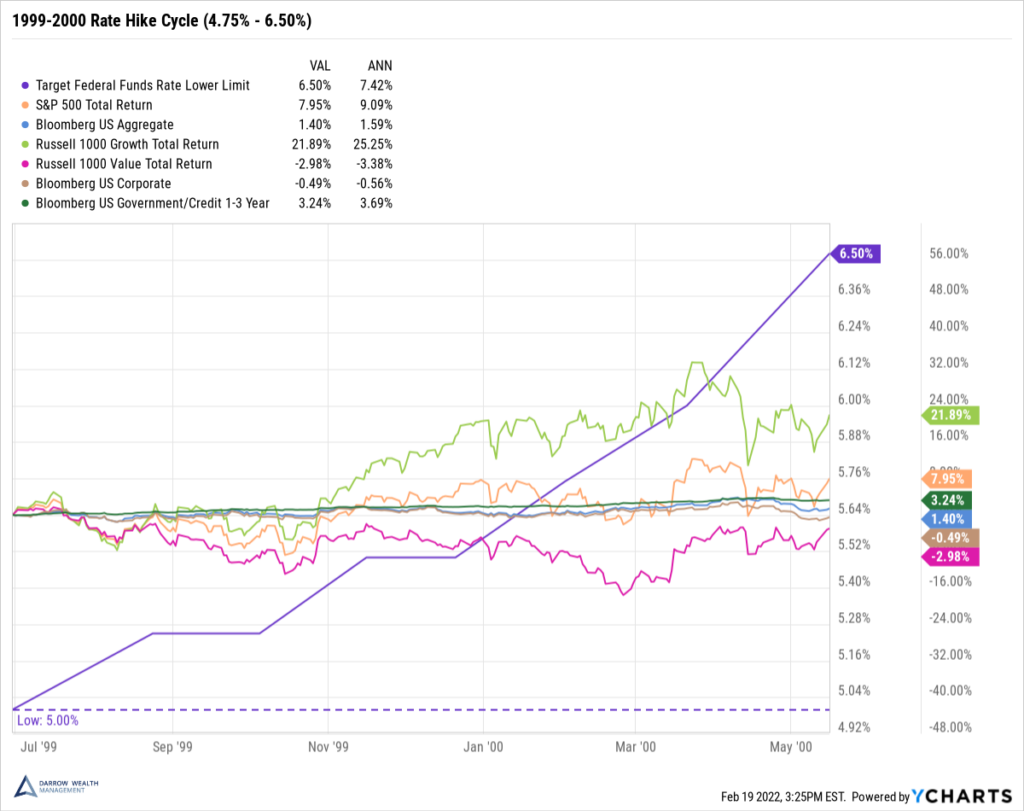
1999 – 2000 (first hike: 4.75% to 5%; last hike put rates at 6.5%)
Between the first rate hike and the last, growth stocks outperformed all other asset classes by an extreme margin. Value stocks were the worst performing. Corporate bonds continue to underperform relative to short-term treasuries and the aggregate bond index. Though the height of the dot com bubble has passed, we’re still far from reaching the lows. The treasury yield curve became inverted before the last rate hike was announced. The yield curve inverts when the spread between the 10 year treasury and the 3 month treasury and/or 2 year treasury is negative. This had been a very reliable indicator of a recession within 1-2 years.
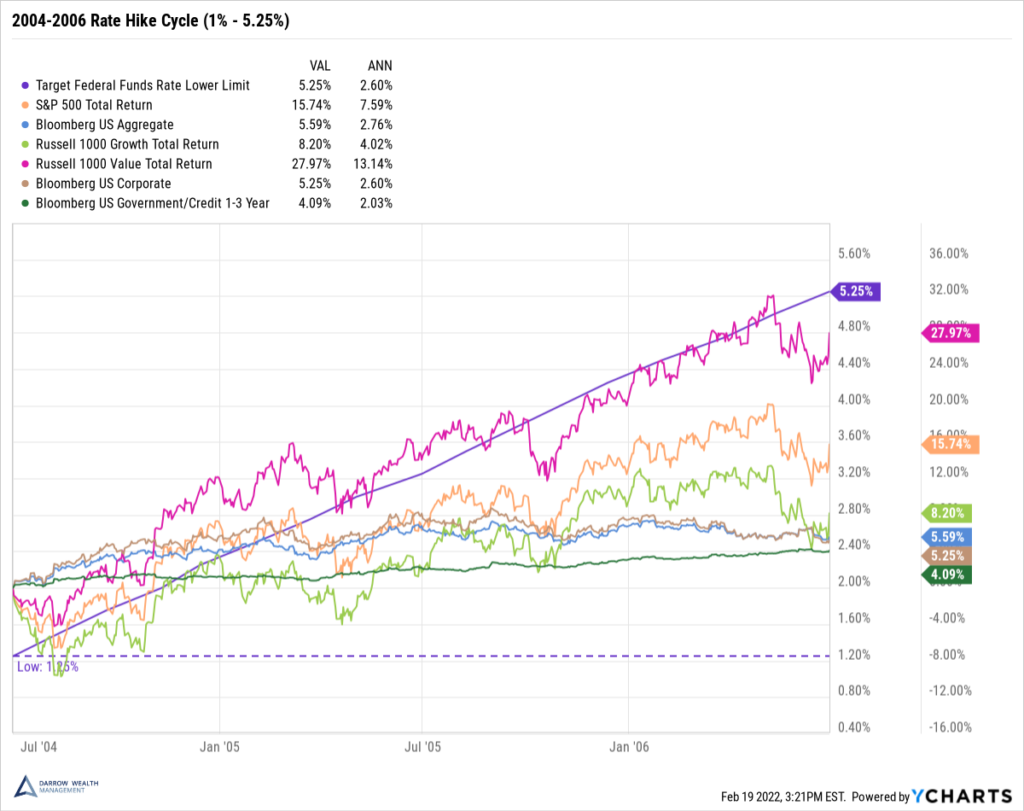
2004 – 2006 cycle (first hike: 1% to 1.25%; last hike put rates at 5.25%)
Different story. Now value stocks are leading the pack by a huge margin. The reversal also extends to credit: now short-dated treasuries are the worst performers, though still positive. It’s worth noting that towards the end of the rate hike cycle, the yield curve began to flatten and ultimately inverted. Again, these are indicators of a recession (the GFC followed). The yield curve can flatten when short-term rates increase faster than longer-dated securities, indicating concerns about slowing economic growth on the horizon.
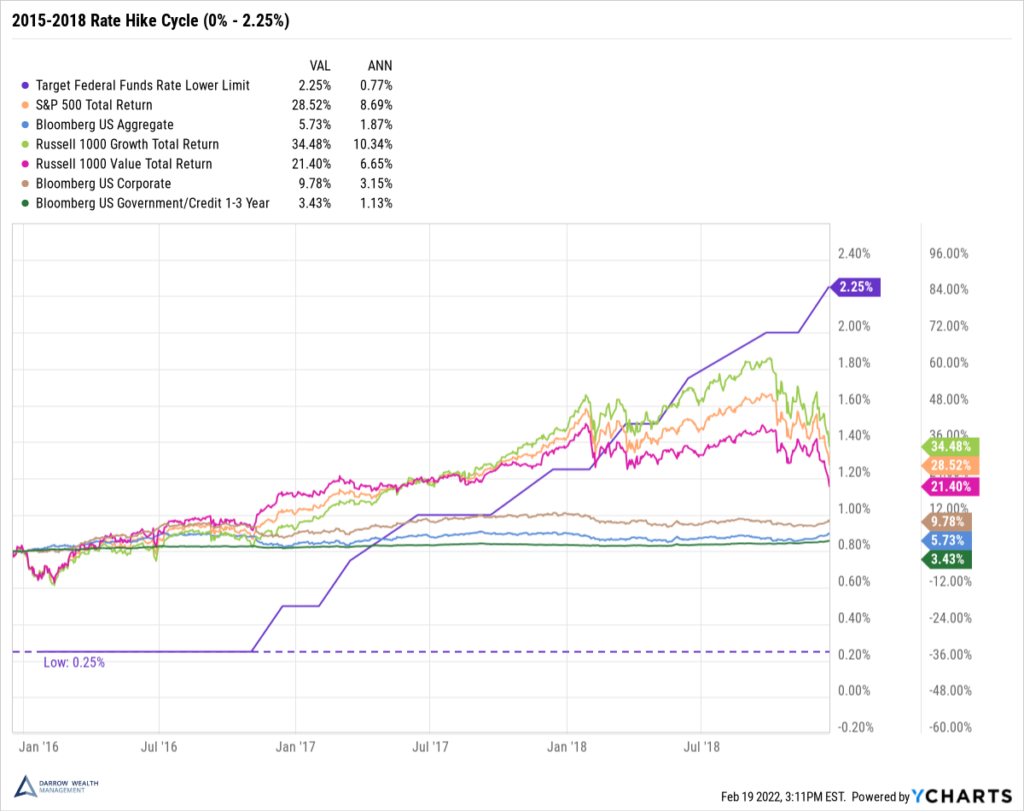
2015 – 2018 cycle (first hike: 0% to .25%; last hike put rates at 2.25%)
Growth outperforms value once again, though by smaller margins this time. There’s a clear point on the chart at the end of 2016 when stocks diverged from bonds. This is the 2016 presidential election. Risk assets began to surge on hopes of tax cuts and business-friendly policy. For the first time, we see US Corporate bonds outperforming the rest of fixed income. This is yet another example of the multiple narratives at play and the impact on markets.
When happens when the Fed is done raising rates? Asset class performance 6 months after the last rate hike
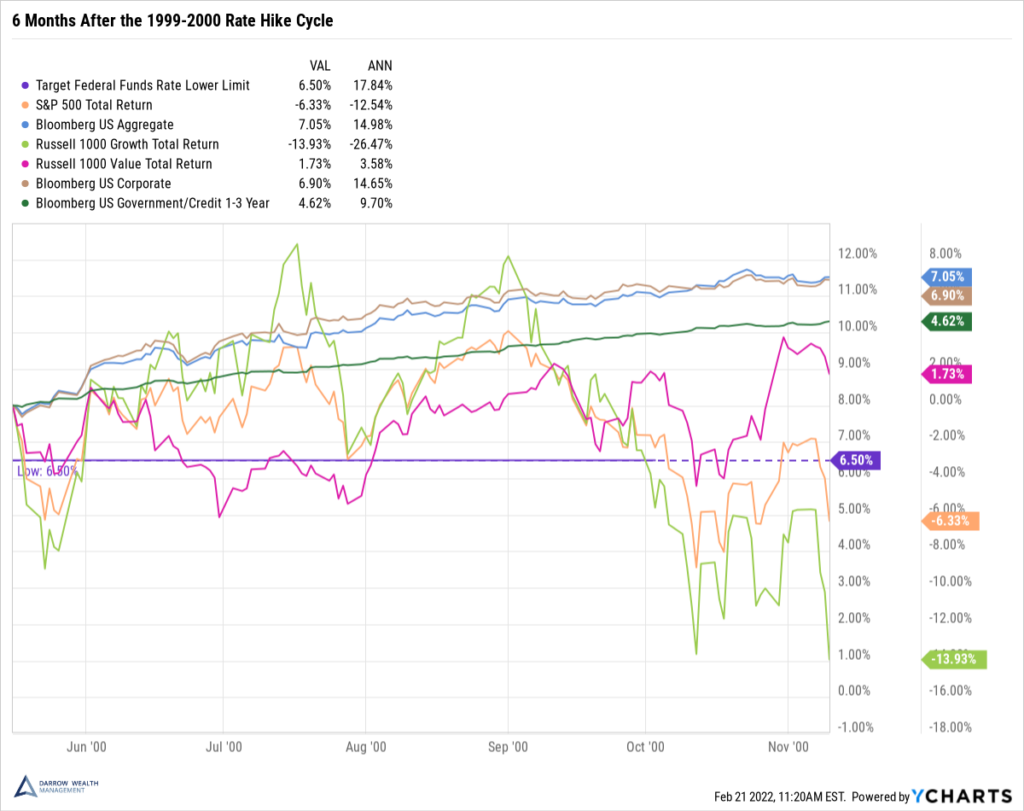
6 months after the 1999 – 2000 cycle
Growth stocks are suffering big losses as the dot com bubble continues to pop. When the Fed last raised rates in May 2000, the Nasdaq Composite index (not pictured) was down more than 26% from its high, and the Russell 1000 Growth index over 8%. It would get worse from here. By March 2001, the US was in a recession. In the 6-12 months after the last interest rate hike, bonds would continue to outperform stocks, providing some protection during volatility.
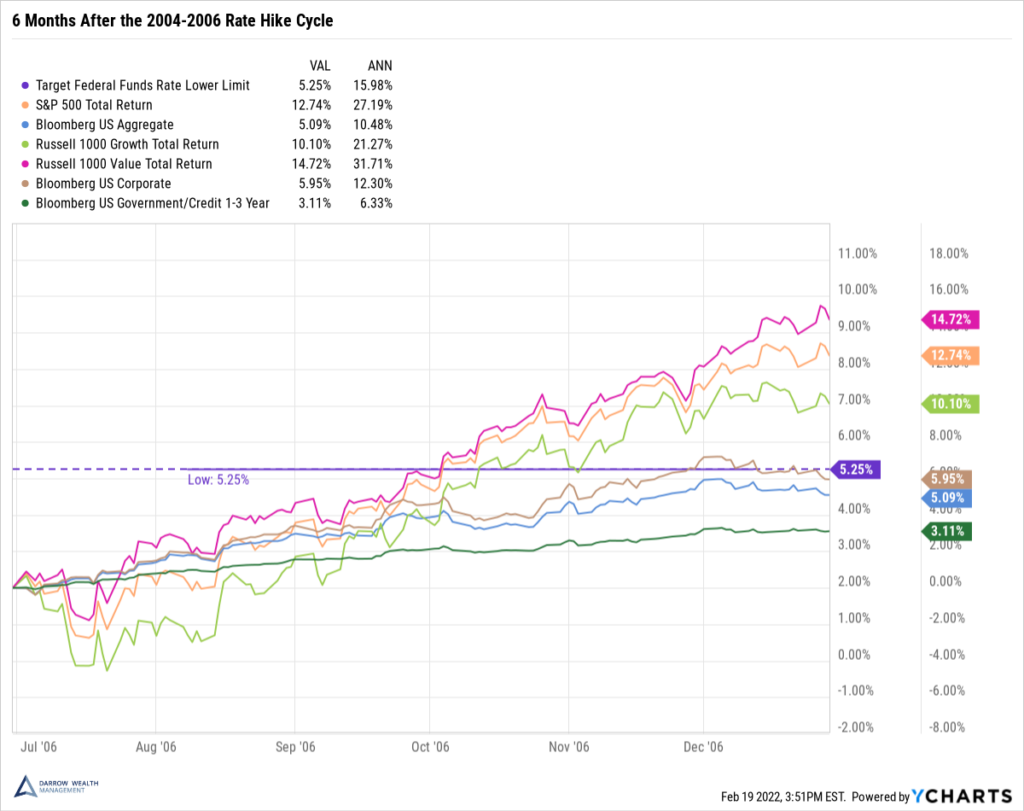
6 months after the 2004 – 2006 cycle
After the conclusion of the rate hikes in 2006, the markets continued to enjoy strong returns. Value stocks again led the equity pack. When interest rates rise, it can put pressure on growth stocks as their profits are expected to be realized in the future, and therefore must be discounted at current interest rates. This relationship doesn’t always materialize, though. For one reason, value stocks tend to be more sensitive to economic conditions. Corporate bonds, which are more correlated to equities, outperformed the other bond indices. After the last rate increase, the yield curve began to flatten then invert amid concerns amount mid-term economic growth before the GFC.
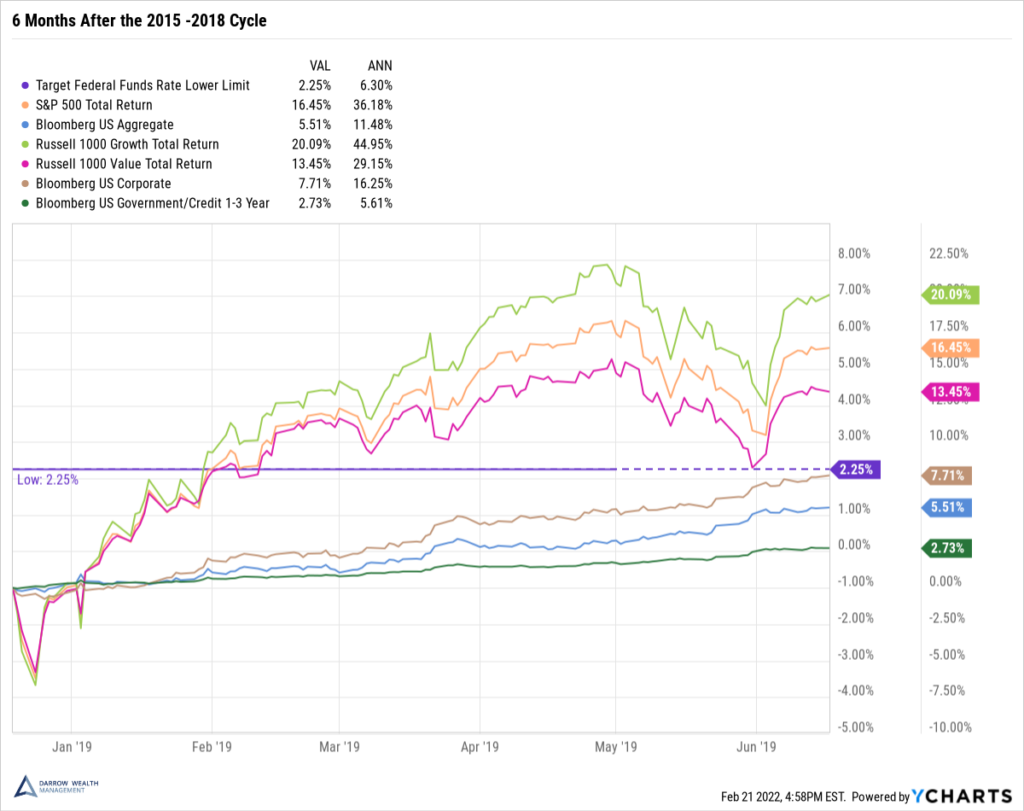
6 months after the 2015 – 2018 cycle
Although the Fed raised rates, it wasn’t to the extent that had been done in the past and took quite some time to do it. As had happened in the past, the yield curve began to flatten and invert. Interestingly, the recession to follow was due to Covid-19, so investors are left to wonder whether the US would have entered a recession absent the pandemic (which no one could have possibly predicted). Despite Covid-19, the S&P 500 would double between 2019 – 2021.
How should you invest when interest rates are rising?
Positioning your portfolio for a specific expected economic event or investment outcome (such as a market correction) is incredibly difficult. First, you’ll need to correctly predict which asset class or sector is going to outperform this time. Second, you’ll need to make the trades before the rotation is already priced in or prior to a steep decline. Third, you’ll then need to get out of those positions before the cyclical reversal. All the while incurring taxes if trading in a brokerage account.
Trying to buy low and sell high reliably is practically impossible. But it doesn’t matter that much over the long-term. Since markets go up more than they go down, there’s a decent chance you could be selling high (if you’re lucky) only to sit in cash and buy again at even higher prices.
Investor concerns about the financial implications of a recession are understandable. However, recall that markets are forward-looking and economic data is inherently looking through the rear-view mirror. At an extreme example, when US stocks bottomed during the Covid-19 pandemic, not enough time had passed to formally declare a recession.
Preparing for the inevitable
The best way to weather market volatility is to plan for it before it arrives. Make sure your portfolio is properly diversified but understand there isn’t always somewhere to hide. Bonds have offered protection during past recessions and market downturns but there are no magic bullets. All investing involves risk. But that doesn’t mean you should go to cash – that can be most damaging. Staying invested and sticking to your financial plan is important. Properly assess your true risk tolerance and be aware of your time horizon. Many of us will be fortunate enough to spend several decades in retirement alone.
Historically, over time, broad-based markets have gone up. This includes periods when the Federal Reserve is raising interest rates.
It’s also important to note that this entire article has been on US assets. We live in a very global economy. Different central banks will have varying monetary policy, economic cycles, currency valuations, geopolitical tensions, and so on. As an example, during the 2004-2006 rate hike cycle, ex-US stocks and bonds significantly outperformed their US counterparts.¹ Year-to-date, international ex-US assets have been outperforming domestic stocks and bonds. Diversification across the global universe of investable assets can help mitigate risk – to a point.
Disclosures
Examples in this article are generic, hypothetical and for illustration purposes only. Both past performance and yields are not reliable indicators of current and future results. This is a general communication for informational and educational purposes only and not to be misinterpreted as personalized advice or a recommendation for any specific investment product, strategy, or financial decision. This material does not contain sufficient information to support an investment decision and it should not be relied upon by you in evaluating the merits of investing in any securities or products. If you have questions about your personal financial situation, consider speaking with a financial advisor.
All indexes are unmanaged and an individual cannot invest directly in an index. Index returns do not include fees or expenses. Past performance is not indicative of future results.
¹ MSCI ACWI ex-USA (stocks) and Bloomberg Global Aggregate ex-USA