
Stocks and bonds differ in many aspects, including the risk and return investors can expect. Because of these differences, stocks and bonds accomplish different things in an asset allocation. When you own a stock, you’re buying a piece of equity ownership in the company. With bonds, you’re buying the issuer’s debt.
Stocks have unlimited growth potential but also more volatility. Bonds, however, are more stable investments that provide income, but have much less upside. Bonds are also less risky than stocks because in the event of bankruptcy, bondholders will get repaid first. Stockholders are last in line and usually get nothing. Bonds offer predictable fixed income in the form of regular interest payments.
Because of the different risk and return profiles, there are benefits of holding stocks (equities) and bonds (fixed income), it’s not usually an either-or. They both have a place, though in different weightings, which change over time. Since bonds traditionally offer stability and income, but not much growth, equities are key to help investors keep pace with inflation over the long-term.
Quick overview and key differences between stocks and bonds
- Stocks represent equity ownership. Bonds are debt investments, representing the borrower’s commitment to repaying that loan with interest over time
- Unlike stocks, which are issued by corporations, fixed income issuers can be governments (like US Treasury bonds) or companies
- There are many different categorizations and investment opportunities within the equity and fixed income markets. For example, stocks are categorized by sectors, region, market capitalization, style, etc. while bonds are broken down by duration and sectors (for example government bonds such as municipal or Treasury bonds or corporate bonds, including investment grade or high yield bonds), etc.
- Stocks returns are mostly in price appreciation, though companies can also pay dividends. Bonds don’t offer nearly as much upside in terms of price appreciation, but fixed coupon payments can provide a stable income stream for investors
- The bond market is very sensitive to changes in interest rates, while the stock market is more sensitive to economic inputs like consumer spending and changes in policy that may affect businesses, such as federal income tax policy. The choice between stocks and bonds depends on their individual circumstances, such as risk tolerance, time horizon, and financial goals.
Bond Basics: How Bonds Work and Reasons to Add Bonds to Your Portfolio
Stock vs bond historical returns by calendar year
Investors don’t hold bonds to outperform stocks over the long run. That’s not their job. But bonds offer fixed interest and more stability than stocks. So in exchange for less volatility, bond investors are willing to sacrifice some of the upside they might get with equity.
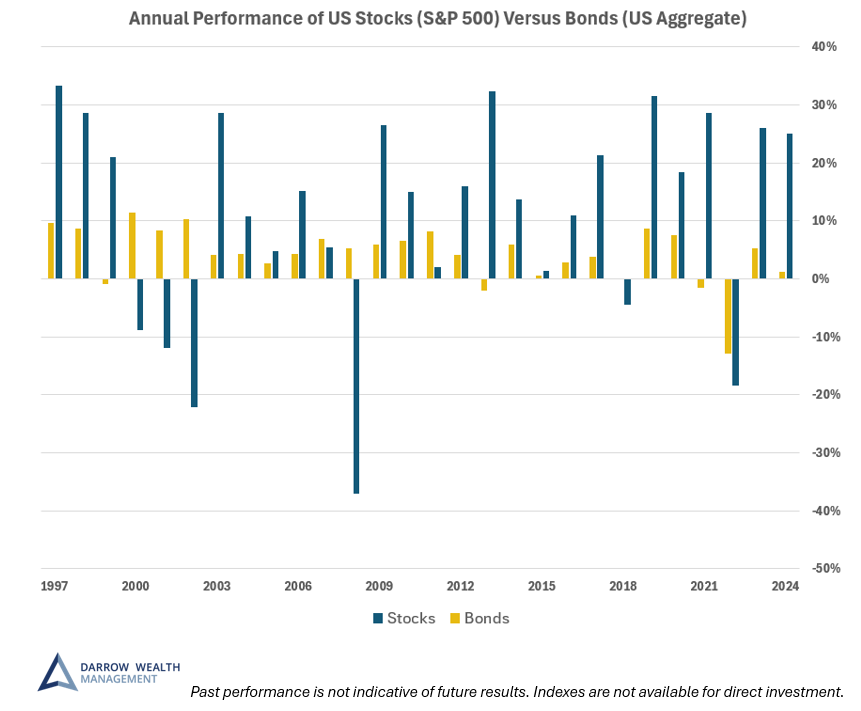
Stocks vs bonds historical total returns by calendar year (1997 – 2024)
Top takeaways:
- Between 1997 and 2024, the S&P 500 returned 9.7% on an average annualized basis. The US Aggregate Bond index returned 4.1%. Both reflect total returns, which includes dividend income
- Stocks are clearly more volatile which reflects the higher risk. Historically, if we consider price returns only, US stocks still tend to experience positive annual returns 75% of the time
- Fixed income securities have lower risk on a relative basis, which is why historical performance isn’t as high. The bond market does not experience losses over a calendar year very often (only 10% of the time going back to 1980)
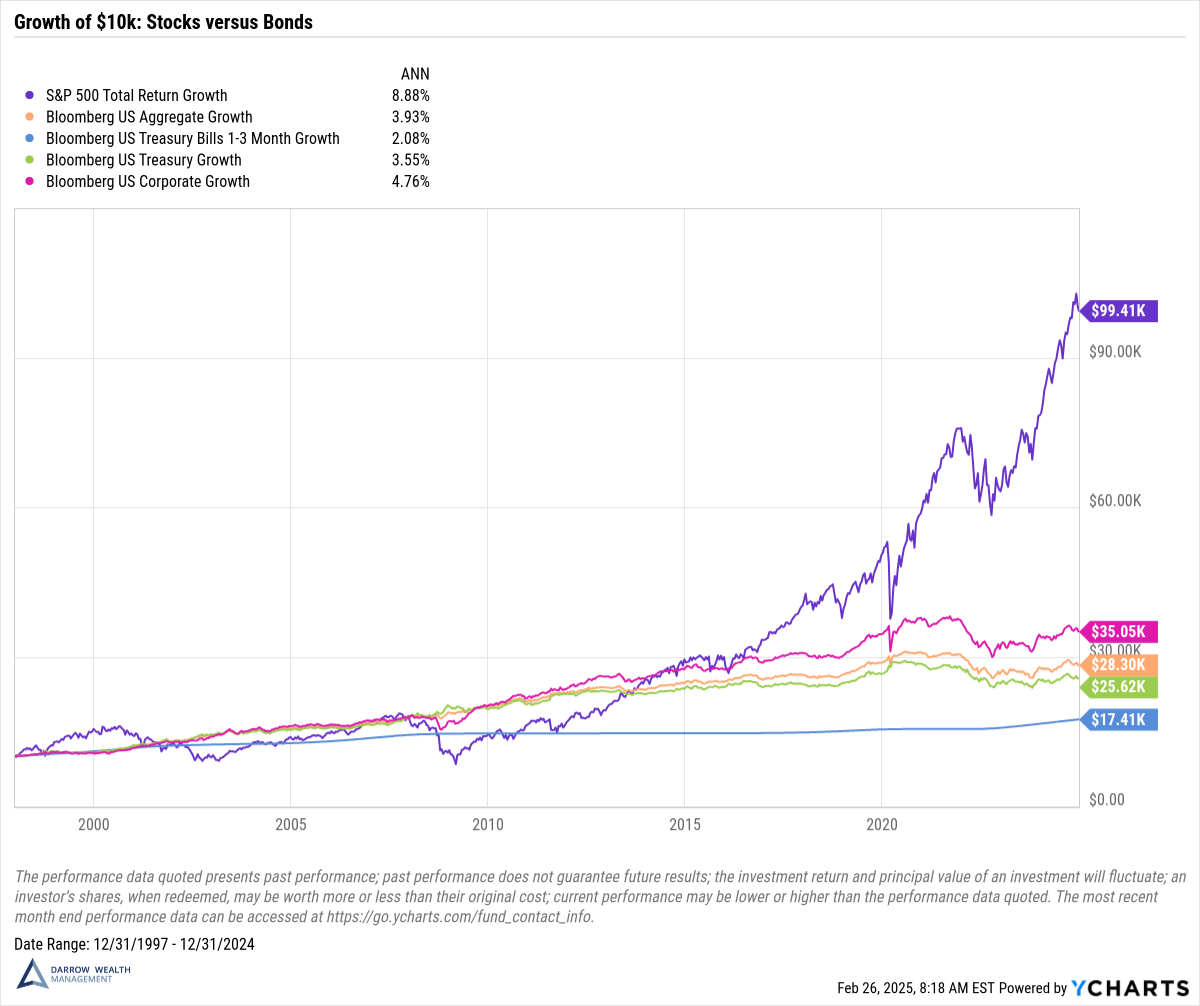
Long-term growth of $10,000: stocks vs fixed income
Understanding an investor’s timeline and comfort level is key when making investment decisions. While an investor’s timeline affects their risk tolerance and allocation decisions between stocks and bonds, it’s important to remember how long a retirement time horizon can truly be.
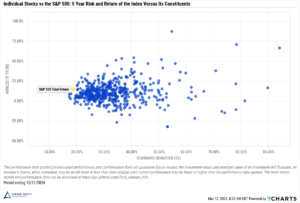
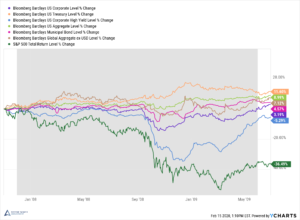
The chart below shows how cumulative US stocks versus bond returns can impact a portfolio over time. This illustration includes Treasury securities (the aggregate index and short term bills), the US aggregate bond index as a whole, and finally corporate investment grade bonds. (Note: Since most investors are more familiar with stocks, a comparison of risk and return within the equity market has been intentionally omitted from this article).
Again, past performance is not indicative of future results, markets move, and correlations and relationships can change. But it helps illustrate the importance of diversifying within an asset class like fixed income.
The growth of $10,000 over 27 years varies significantly depending on the investment. And while stocks have crushed bonds over this time period, less volatile bonds still have a place in most portfolios as a ballast. But returns on a 100% fixed income portfolio aren’t going to meet the needs of most retirees. And keep in mind – this chart just reflects an unmanaged index you can’t even invest in. Taxes, fees, expenses, trading costs, etc. can all weigh on performance.
Why stocks and bonds belong in a diversified portfolio
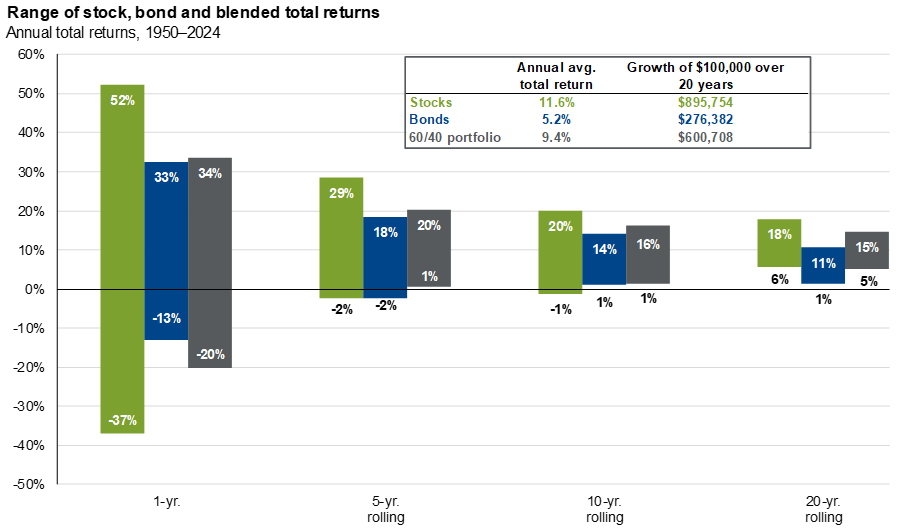
Investors have different needs, risk tolerances, time horizons, and financial situations which should be considered in an asset allocation. While bonds can help limit portfolio drawdowns, they also come with less upside.
As the chart below illustrates, the risk of losing money as a long-term investor has historically gone down over time across bonds, stocks, and a diversified mix of both. Owning both stocks and bonds can reduce the variability of returns and offer some protection against large sharp losses. Both of these help investors stay the course during market downturns.
Benefits of diversification over time
Diversification is great, but it’s not a magic bullet
Utilizing asset classes with a low or negative correlation helps provide protection as securities in a portfolio may respond differently to changing financial conditions. But correlations shift over time and within the asset class itself. Between 2015 and Q3 2024, the correlation between stocks and bonds was .32 according to data from J.P. Morgan Asset Management.
But data from YCharts indicates the rolling 3-year correlation between US stocks (S&P 500) and US bonds (Bloomberg Barclays US Aggregate Bond index) has increased sharply the past few years. If bonds are more correlated with stocks, it poses a greater risk to investors’ portfolios in a market downturn.
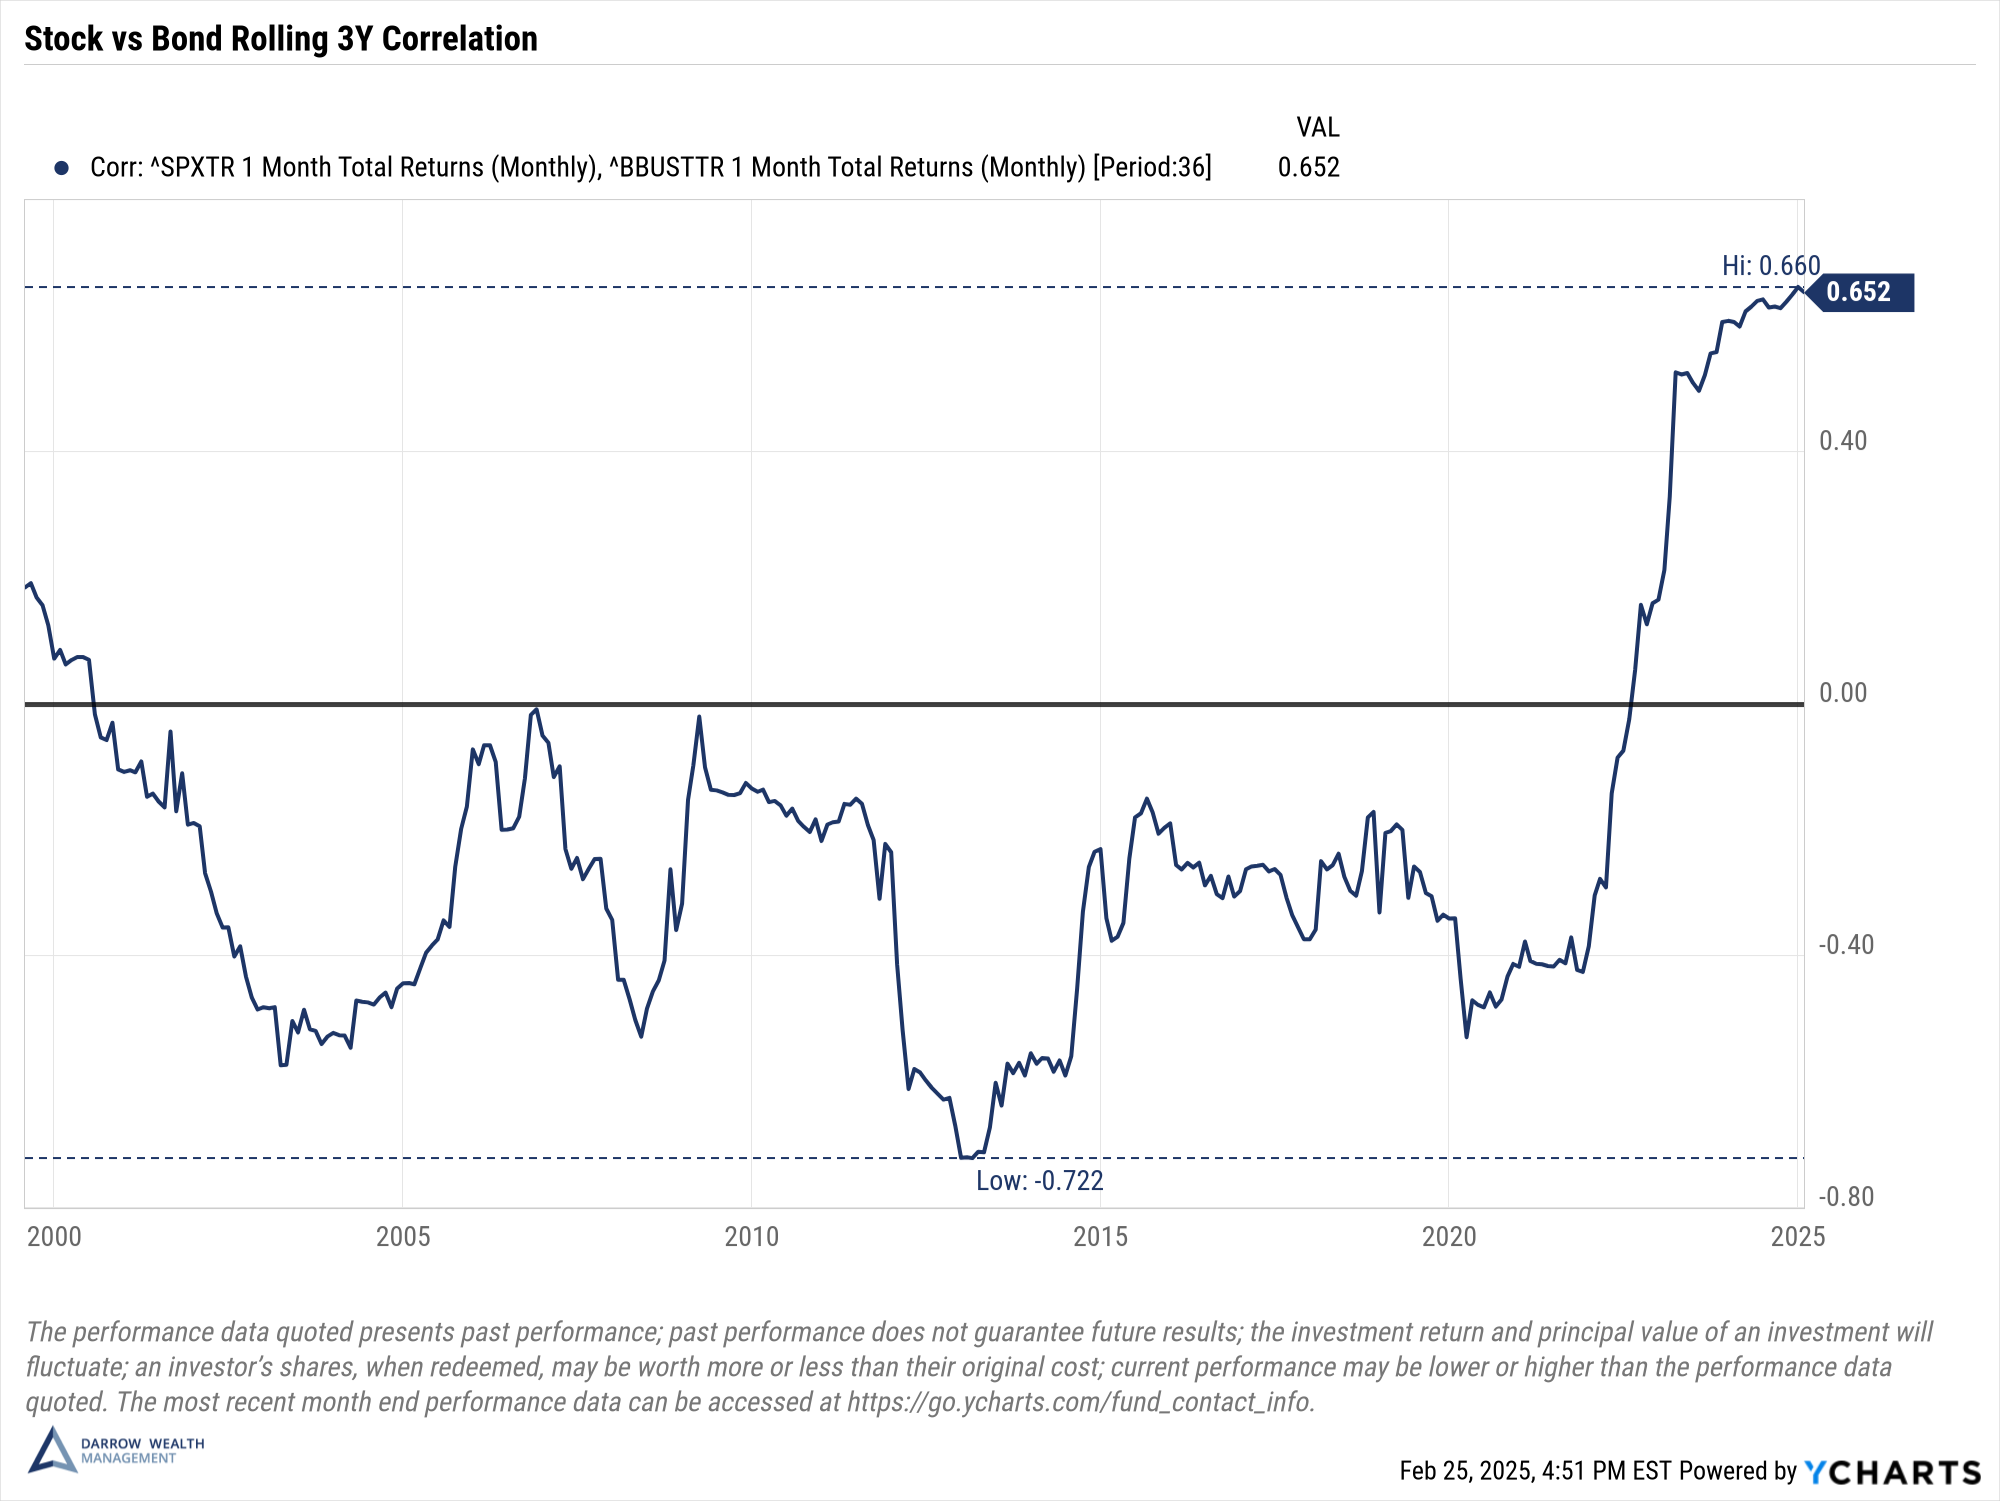
Remember, markets move. And while bonds can help protect investors against extreme losses, it’s important to realize that there isn’t always somewhere to hide and all investments involve risk.
For reference, a correlation of 1.0 means the assets are perfectly correlated and will move in tandem. A -1.0 correlation means the assets are perfectly negatively correlated, so as one asset moves in one direction, the other will move by the same amount, but in the opposite direction. A correlation of 0 means the assets have no relationship and move independently from one another.
Help managing your investments
There’s a lot to keep in mind as you build a diversified portfolio. Consider working with a fiduciary financial advisor to help manage your investments and provide financial planning guidance before and during retirement. After all, investment management is an ongoing process.
Over the long term, as your life changes, you’ll need to consider whether your weightings in stocks vs bonds is appropriate. As economic conditions and income needs change, so too will your asset allocation. After all, volatility is a when, not an if. Retirement planning, like any type of robust financial planning, should include stress testing your investment strategy and financial plan.
Disclosures
Past performance is not indicative of future results. All indexes are unmanaged and an individual cannot invest directly in an index. Index returns do not include fees or expenses.
Examples in this article are generic, hypothetical and for illustration purposes only. Both past performance and yields are not reliable indicators of current and future results. This is a general communication for informational and educational purposes only and not to be misinterpreted as personalized advice or a recommendation for any specific investment product, strategy, or financial decision. This material does not contain sufficient information to support an investment decision and it should not be relied upon by you in evaluating the merits of investing in any securities or products. If you have questions about your personal financial situation, consider speaking with a financial advisor.
[Last reviewed February 2025]